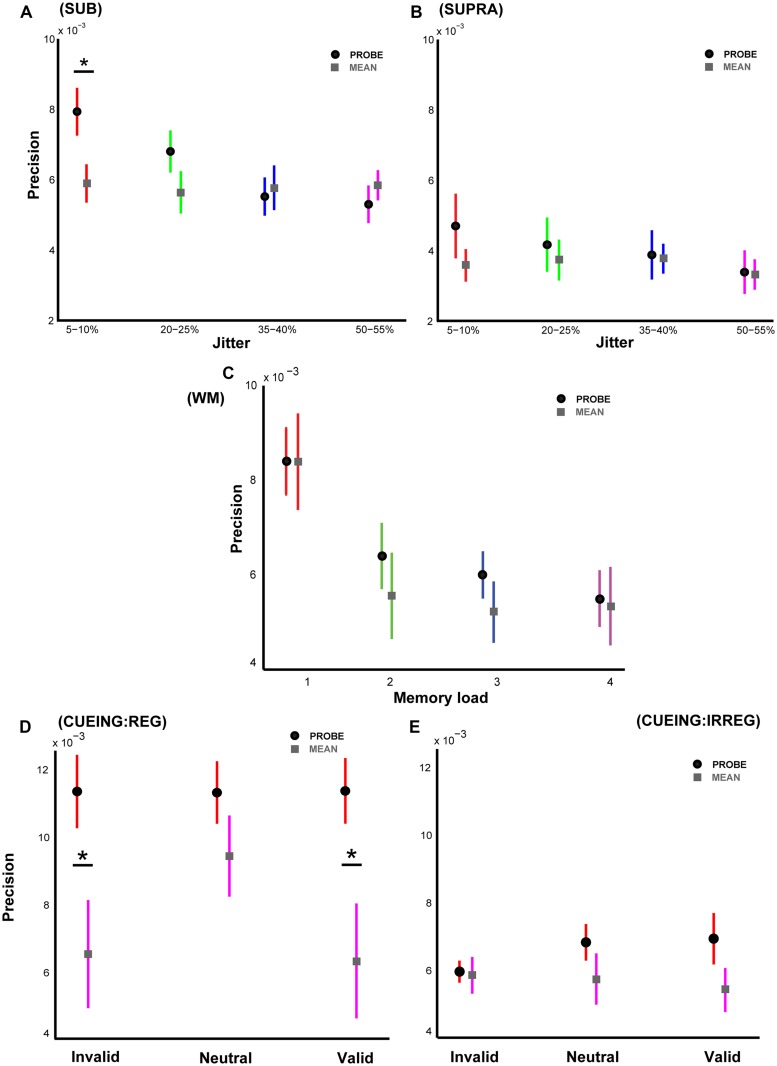
FIGURE 2.
Experimental results based on responses to average interval duration. Precision based on a hypothetical response to the average duration of the intervals in a sequence with mean precision in gray squares is plotted alongside the actual precision values with mean precision in black circles as in Figure 1. (A) Shows the two precision values for Experiment 1, (B) for Experiment 2, (C) for Experiment 3, (D) for Experiment 4A, and (E) for Experiment 4B respectively. An asterisk denotes statistically significant difference at a threshold of p < 0.05. Error bars represent one SEM.

