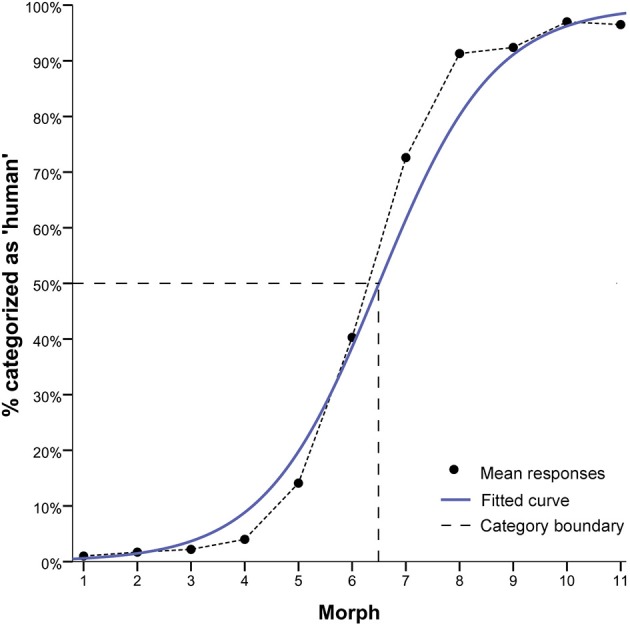
Figure 4.

Results of the forced choice classification task. Mean responses are depicted in terms of % of “human” responses, with the grand average across all continua (continuous blue line), the fitted logistic curve based on the grand mean (black line), and the category boundary (dashed gray line) to indicate the point of maximum uncertainty of 50% in categorisation judgements along the continua. Results indicate a step-like response function consistent with the presence of a category boundary. Morph M6 shows the greatest categorisation ambiguity.
