
Figure 2.
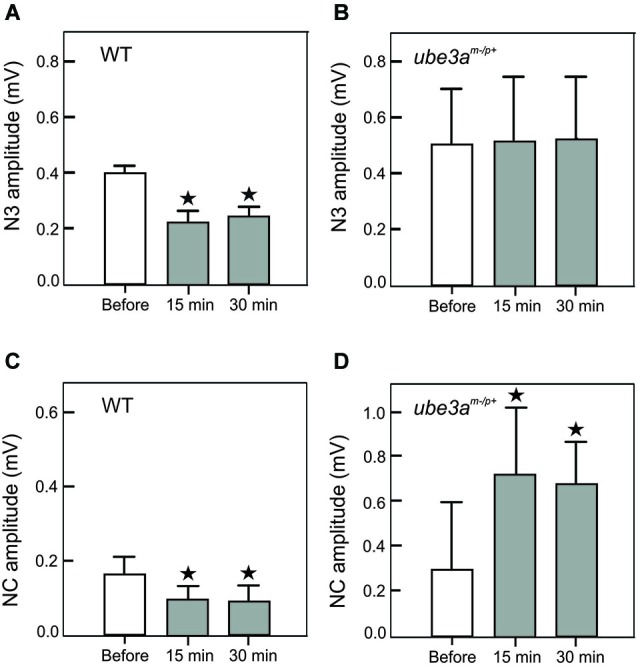
Amplitude histogram of cerebellar N3 LFP component (A, B) and the negative component (NC) of the S1 cortical area (C, D). These components were recorded before, 15 and 30 min after the 8 Hz LTD-inducing protocol in WT (A, C) and in Ube3am−/p+ mice (B, D). Note the presence of a LTD of N3 and NC in WT mice (A, C) and the absence of modification of N3 (B) and the presence of a LTP in Ube3am−/p+ mice. The asterisks correspond to p < 0.05.