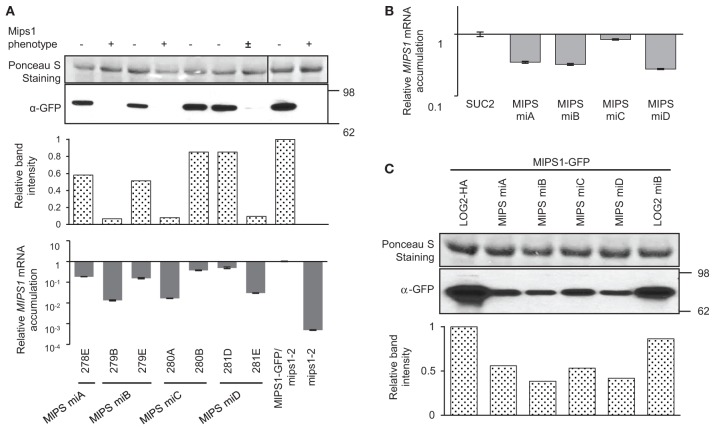
Figure 2.
Analysis of amiRNAs targeting MIPS1 in stably transformed Arabidopsis and in transiently transformed N. benthamiana. (A) amiRNAs targeting MIPS1 (MIPS miA, miB, miC and miD) were stably introduced into the MIPS1-GFP/mips1-2 background. The phenotype of about 10 progenies of each line was recorded (“−,” wild type; “±,” intermediate between mips1 and WT; “+”, mips1). MIPS1 protein levels were determined by western blot with an anti-GFP antibody; band intensities are expressed relative to the maximum (line MIPS1-GFP). MIPS1 relative mRNA levels were measured by qRT-PCR (accumulation is expressed relative to the mRNA levels in MIPS1-GFP/mips1-2). Error bars represent standard error processed by qbasePLUS. (B) Relative MIPS1 mRNA levels in transiently transformed N. benthamiana. MIPS1 was co-expressed with SUC2 or amiRNAMIPS1. MIPS1 mRNA levels were estimated by qRT-PCR and expressed relative to levels in leaves transformed with MIPS1 and SUC2. Error bars represent standard error of three biological replicates. (C) Western blot showing the effects of amiRNAMIPS1 on MIPS1 protein accumulation in transiently transformed N. benthamiana; band intensities are expressed relative to the maximum (sample LOG2-HA). amiRNALOG2 (LOG2 miB) was used as negative control, and co-expression of LOG2-HA was used as co-expression control. Numbers on the right indicate molecular weight in kDa.

