
Figure 5.
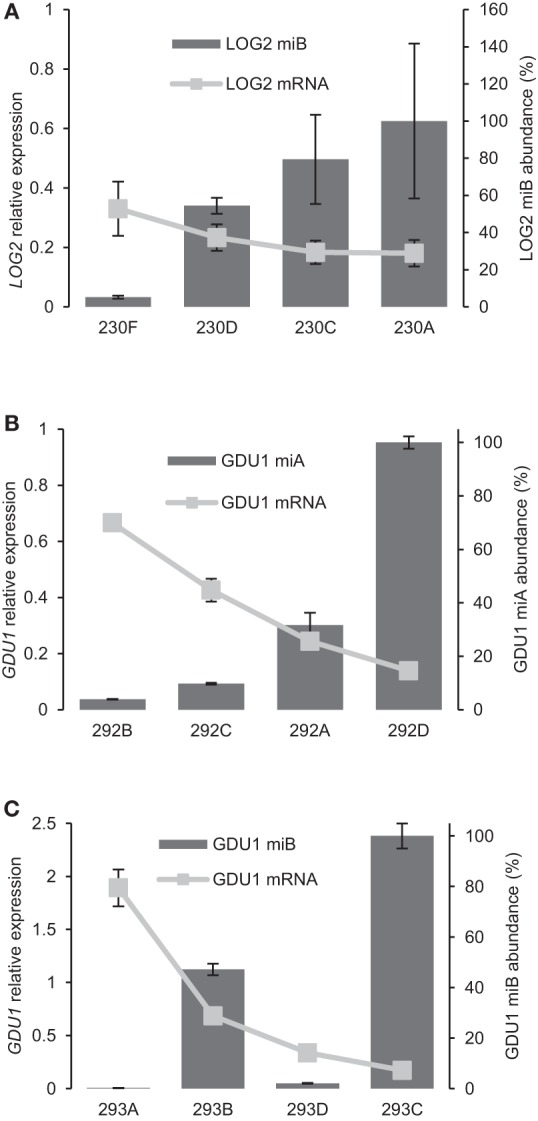
Analysis of the relationship between abundance of amiRNA and target mRNAs. (A) amiRNALOG2-B abundance determined by qRT-PCR for the same lines as in Figure 1A. Accumulation is expressed relative to the highest expression (line 230A). LOG2 mRNA level is expressed relative to levels in gdu1-1D. (B,C) amiRNA abundance determined by qRT-PCR for amiRNAGDU1-A (B) and amiRNAGDU1-B (C) for the same lines as in Figure 4A. Accumulations are expressed relative to the highest expression (lines 292D and 293C respectively). GDU1 mRNA level is expressed relative to levels in the GDU1-cMyc line.