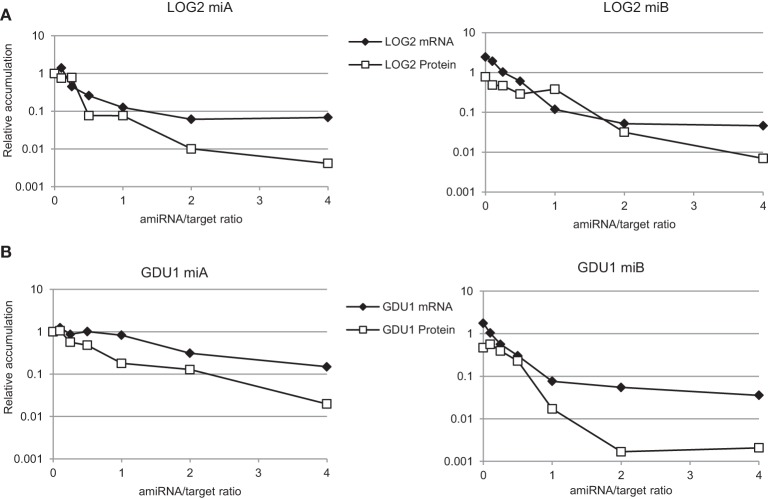
Figure 6.
Analysis of the relationship between amiRNA expression, target mRNA and protein accumulations. Two amiRNAs targeting (A) LOG2 and (B) GDU1. Leaves of N. benthamiana were infiltrated with various ratios of amiRNA / target gene (mLOG2-HA or GDU1-HA), ranging from 0.1 to 4. Control (ratio 0, left panels) corresponds to co-expression of the target gene with SUC2. The ratio 0 for the right panels corresponds to co-expression of the target genes with amiRNASnRK1.1-C. The same amount of the target constructs was infiltrated for each sample. Variable amounts of amiRNAGDU1 (or amiRNALOG2) and amiRNASnRK1.1-C were co-infiltrated to keep constant the total amount of amiRNA expressed in the leaf. Target mRNA and protein levels were determined by qRT-PCR and western blot respectively. Error bars represent standard error processed by qbasePLUS. Levels are expressed relative to the 0 ratio of the left panels.

