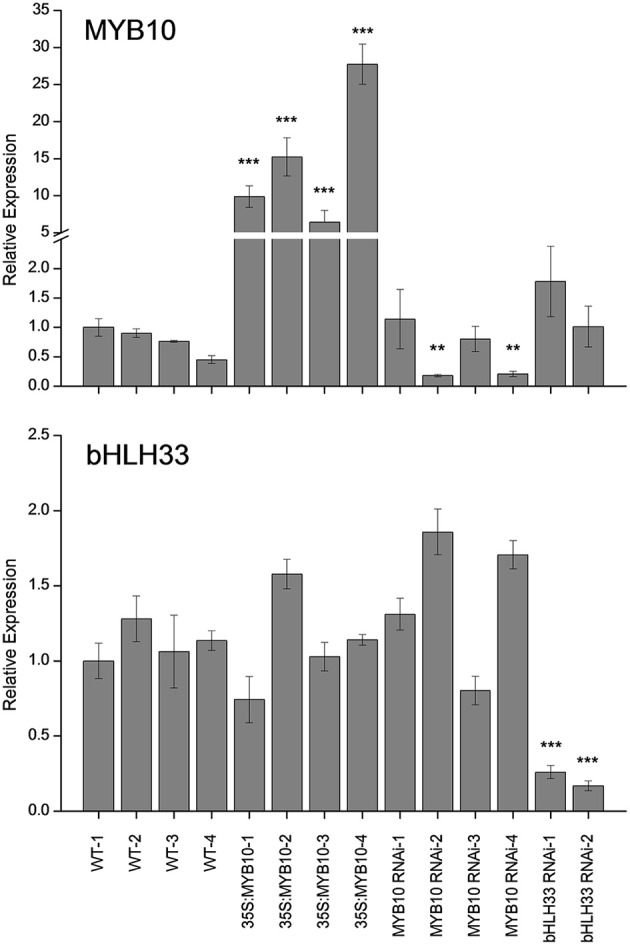
Figure 2.

Expression analysis of FvMYB10 and FvbHLH33 in 35S:FvMYB10, FvMYB10 RNAi, FvbHLH33 RNAi, and wild type-controls. The expression of FvMYB10 increased by 6 to 30-fold in all 35S:FvMYB10 lines, and decreased by 3 to 6-fold in two FvMYB10 RNAi lines (FvMYB10 RNAi-2 and FvMYB10 RNAi-4). The transcript of FvbHLH33 was significantly reduced in two FvbHLH33 RNAi lines. Transcript abundance was calculated relative to the geometric mean of GAPDH, PP2a, and UBC9. Errors bars are the SE for three biological replicates. Statistical significance between transgenic lines and wild-type controls was determined by One-Way ANOVA: *P < 0.05; **P < 0.01; ***P < 0.001.
