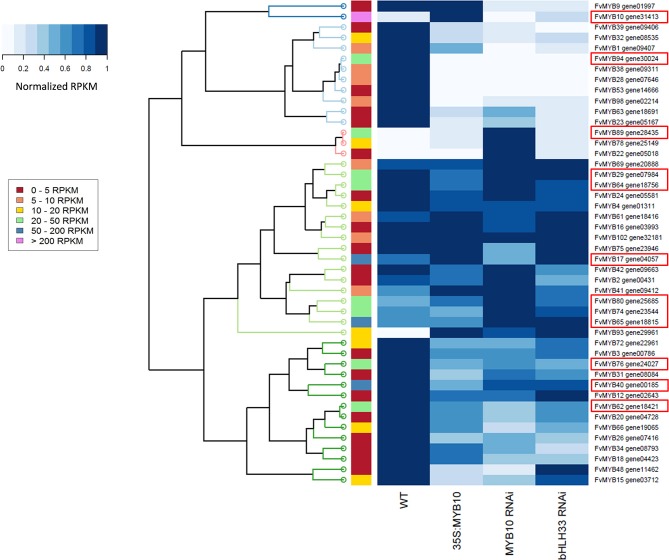
Figure 7.
Hierarchical clustering of MYB transcription factors differentially expressed in mature strawberry fruit from 35S:FvMYB10, FvMYB10 RNAi, FvbHLH33 RNAi, and wild-type control. Heat map of 46 differentially expressed MYB transcription factors generated based on normalized RPKM values. Relative expression levels are represented as colors ranging from white (0: little or no expression) to dark blue (1: highest expression within four libraries) for each MYB gene. Four columns correspond to four RNA-seq libraries (mature fruit from 35S:FvMYB10, FvMYB10 RNAi, FvbHLH33 RNAi, and wild-type control). Each row represents each MYB gene. The color bar on the left indicates the range of the highest RPKM value within four libraries for each MYB gene. Clustering at the level of individual genes is presented by the dendrogram at the left of the heat map. The red box around the gene names represents a candidate gene showing that the RPKM value of the gene in at least one of the libraries greater than 20 and differential expression.

