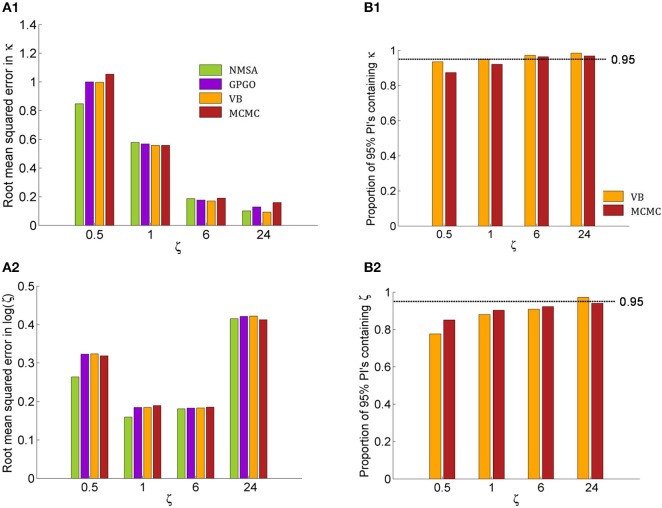
Figure 9.
Quantitative assessment of parameter estimation. (A) Root mean squared error of MAP estimates by noise level ζ for all four estimation methods (see Figure 7 for key to legends). (A1) Estimates for κ improve with decreasing noise and do not exhibit substantially significant differences between methods although NMSA is somewhat better at very high noise. (A2) As in Figure 8, estimates for ζ were assessed at the logarithmic scale. (B) Confidence of VB and MCMC. (B1) Both methods are realistically confident about their inference on κ across noise levels, with a slight tendency toward overconfidence with higher noise. (B2) This tendency is more pronounced with estimates of ζ.

