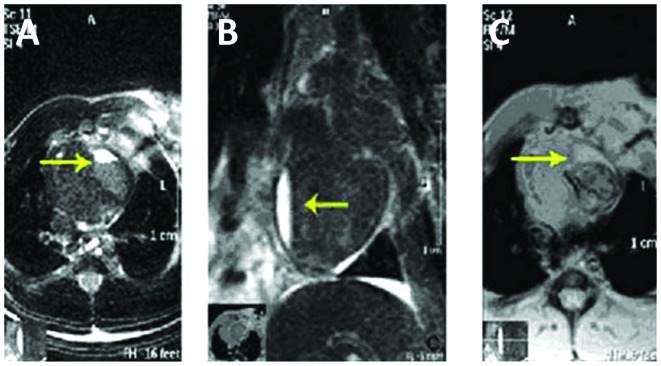
Figure 3.
Magnetic resonance imaging of the infarcted region 2 weeks after coronary artery clamping. In the (A) transverse T2* image and (B) oblique sagittal T2* image, high signal intensity was observed in the area of the infarct. (C) In the transverse T2* image, the boundary between the ischemic region and the surrounding tissue was unclear.

