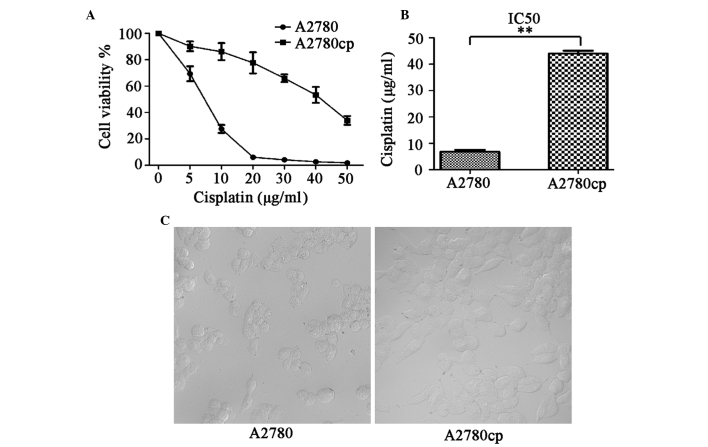
Figure 1.
Effects of cisplatin in A2780 and A2780cp ovarian cancer cell lines. (A) The cells were treated with different concentrations of cisplatin (0–50 μg/ml) for 24 h. The cell viability was determined using a water soluble tetrazolium salt-8 assay. The data are represented as the means ± standard deviation, of three independent experiments; *P<0.05. (B) The half maximal inhibitory concentration (IC50) values of cisplatin in both cell lines were calculated. Each value represents the means ± standard deviation, of three independent experients; **P<0.01. (C) The cell morphology of both cell lines as observed using phase-contrast microscopy (magnification, 400x).

