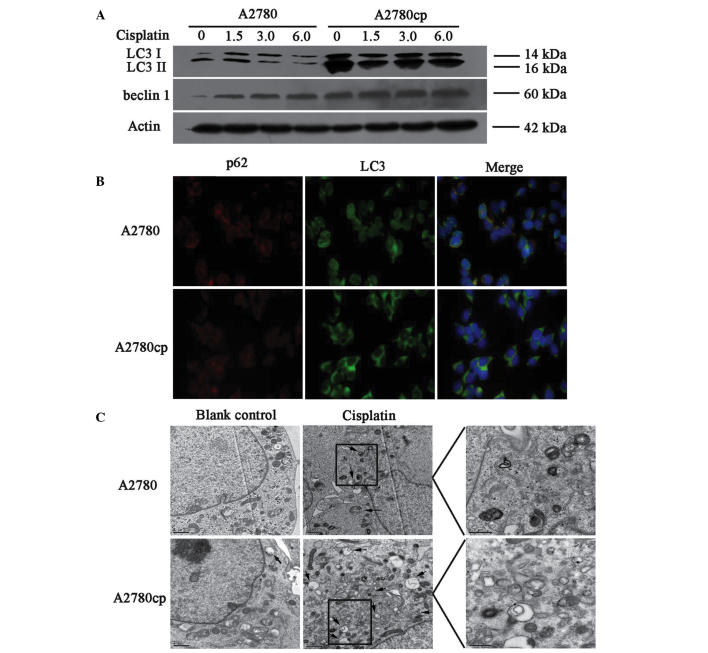
Figure 2.
Autophagy induced by cisplatin treatment in A2780 and A2780cp ovarian cancer cells. (A) The cells were treated with different concentrations of cisplatin (0, 1.5, 3, 6 μg/ml) for 24 h. The cell lysates were collected for western blot analysis using antibodies against microtubule-associated protein 1 light chain 3 (LC3) and Beclin 1. (B) Indirect immunofluorescence of LC3 and p62 was performed in both cell lines, the red signal represents the p62 levels, and the green signal represents the LC3 levels (magnification, 40x). (C) Representative electron microscopy images of autophagosomes (magnification, 10,000x). The scale bars represent 1 μm, and the arrows indicate the autophagosomes. kDa, kilodaltons.

