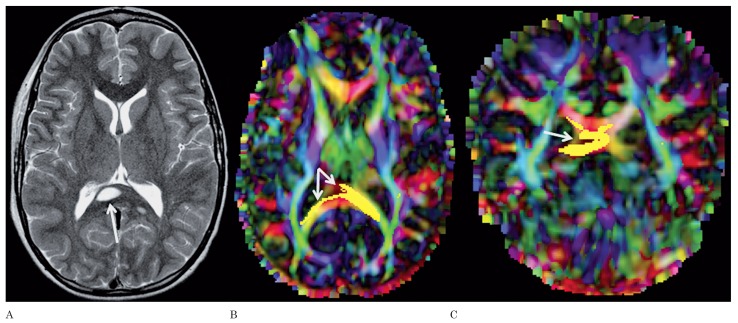
Figure 4.
A) Axial T2-weighted image of patient 10 shows a NBO in the right part of the splenium of the corpus callosum (arrow). A smaller, additional NBO is seen in the right lateral part of the splenium. Axial (B) and coronal (C) color-coded FA maps with superimposed FT of the callosal fibers running through the splenium show disruption of the fibers by the NBO (arrows).

