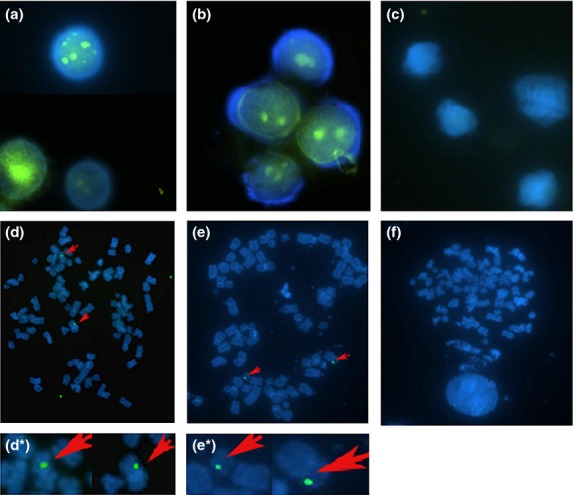
Figure 2.

FISH analysis of HBV DNA integration into CD34+ BM HSCs. 100 × magnification. (a) Green fluorescence hybridization signals in nuclei of CD34+ BM HSCs in the patient group demonstrating HBV DNA integration into BM HSC DNA. (b) Nuclei of HepG2. 2.15 cells showing green fluorescence signal (positive control). (c) Absence of green fluorescence hybridization signal in the nuclei of CD34+ BM HSCs in healthy controls (negative control). (d) Chromosomes of CD34+ BM HSCs of the patient group. Some chromosomes show punctate green fluorescence hybridization signals (red arrows), indicating that HBV DNA gene fragments were integrated into some chromosomes of BM HSCs. (d*): Clipped and amplified chromosomes showing green fluorescence signal from figure d. (e) Chromosomes of HepG22.15 cells with some chromosomes showing green fluorescence hybridization signals (red arrows). (e*): Clipped and amplified chromosomes showing green fluorescence signal from figure e. (f): Absence of green fluorescence signal in the chromosomes of BM CD34+ cells from healthy controls.
