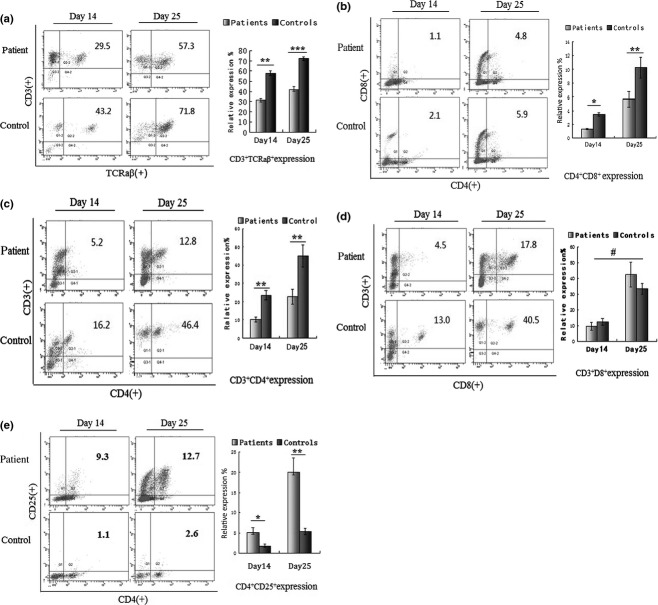
Figure 3.
Expression analysis of T-cell subpopulations generated from CD34+ BM HSCs cocultured with OP9-DL1 cells. (a–e): Flow cytometric and statistical analysis of CD3+TCRaβ+ (a) CD4+CD8+ (b), CD3+CD4+ (c),CD3+CD8+ (d) and CD4+CD25+ (e)T cells on days 14 and 25 in the two groups. The percentage of T cell phenotype expression is indicated on the upper-right side of the cytometric graph. (f) T-cell ratio analysis of CD3+CD4+/CD3+CD8+ on days 14 and 25. Data are shown as mean values ± SD representative of eight independent experiments. P-values were determined using Student's t test. (*P < 0.05, **P < 0.01,***P < 0.001, #P > 0.05).

