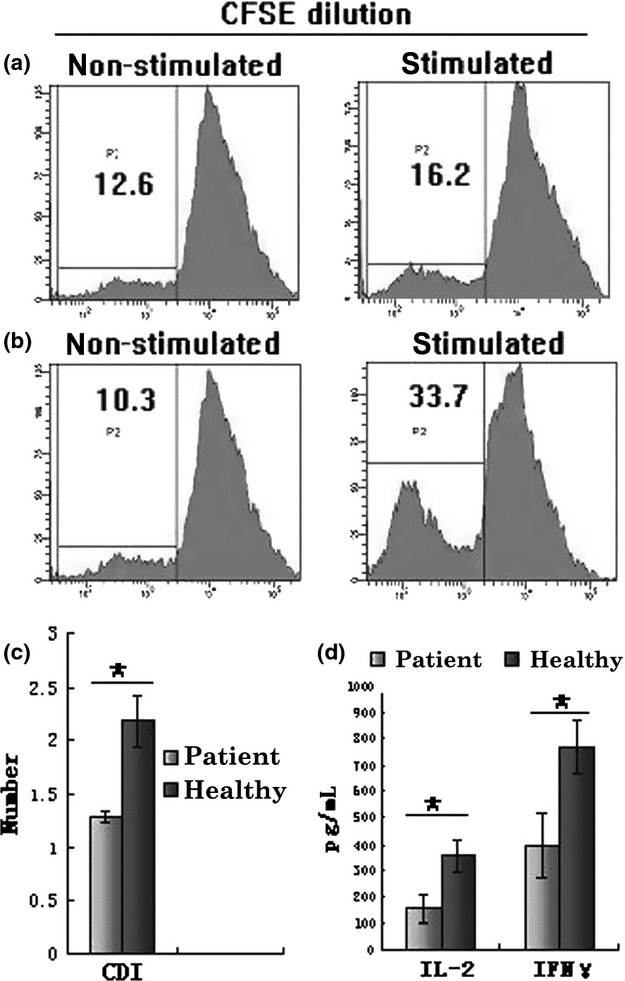
Figure 4.

Analysis of T-lymphocyte proliferation and cytokine production. (a, b) Flow cytometric analysis demonstrating the percentage of decreased fluorescence intensity of PHA-stimulated and non-PHA-stimulated CFSE-labelled T cells from the two groups. The percentage is indicated on the upper left side of the cytometric graph. (a) Healthy control group; (b) patient group. (c) Comparative analysis data of CDI in the two groups. (d) Comparative analysis data of IFN-γ and IL-2 production by T cells harvested from HSC/OP9-DL1 of the two groups following stimulation with PHA for 72 h. The data are represented as mean values ± SD of individual experiments. P-values were determined using Student's t test (*P < 0.05).
