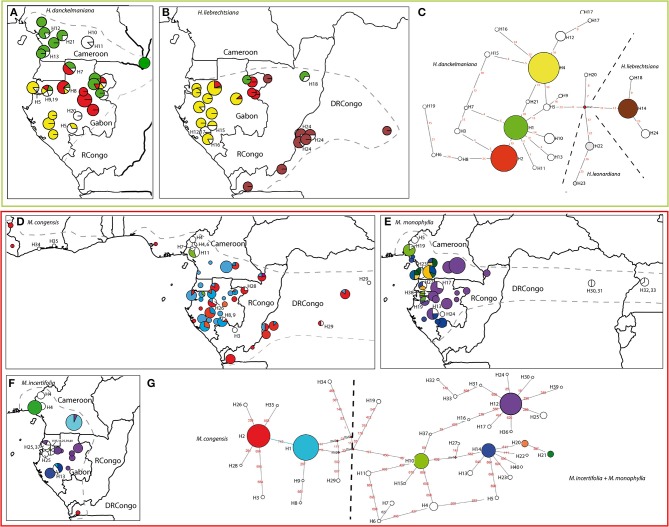
Figure 3.
Geographic distribution of chloroplast haplotypes and generic haplotype networks based on trnC-petN1r updated from Ley and Hardy (2010, 2014). Haumania danckelmaniana (A, C), H. liebrechtsiana (B, C), Marantochloa congensis (D, G), M. monophylla (E, G), M. incertifolia (F, G). Gray hatched line: species distribution range. Sizes of circles are proportional to sample sizes at each locality in the geographic maps and proportional to haplotype frequency in the haplotype network. Frequent haplotypes are color-coded, rare haplotypes are number-coded. Stippled lines throughout the networks delineate groups of haplotypes according to the species in which they are usually found, but haplotypes can also be shared among species. Red numbers along branches are IDs of mutations, mv indicate median vectors (Bandelt et al., 1999).

