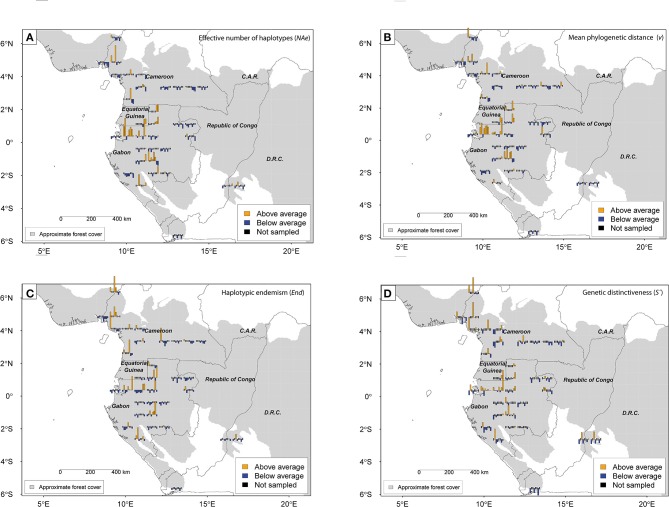
Figure 4.
Geographic distribution of standardized (i.e., centered and reduced) genetic diversity and endemism for eight Marantaceae species in Lower Guinea for grid cell size 0.75°. Effective number of haplotypes (NAe) (A); mean phylogenetic distance between individuals (v) (B); haplotypic endemism (haplotype range <200 km, End) (C); Genetic distinctiveness of each grid cell (S'i) (D). Distinctiveness above or below average is based on standardized pairwise genetic distance (S'kij computed for each species) among populations where genetic distance is estimated as the number of mutational steps between two individuals drawn from two populations (vij). Species along barplots from left to right are: Halopegia azurea, Haumania danckelmaniana, H. liebrechtsiana, Marantochloa congensis, M. incertifolia, M. monophylla, Megaphrynium macrostachyum and Mega. trichogynum.

