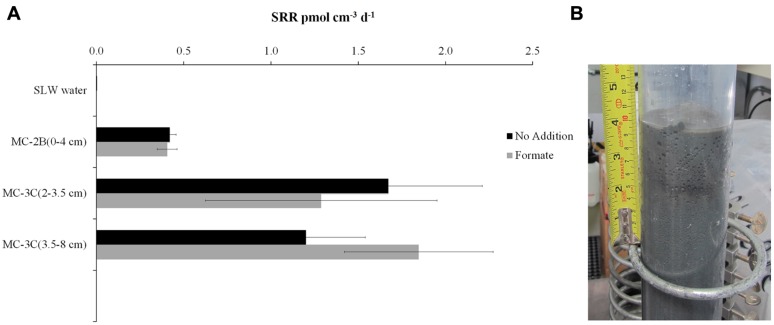
FIGURE 2.
Sulfate reduction rates (SRR) in SLW sediment samples. (A) SRR for killed controls was subtracted from each sample replicate. Black bars represent sediment incubations with no carbon addition; Gray bars represent sediment incubations with 50 mM formate addition (± SD of triplicates). (B) Image of SLW sediment core MC-2B.

