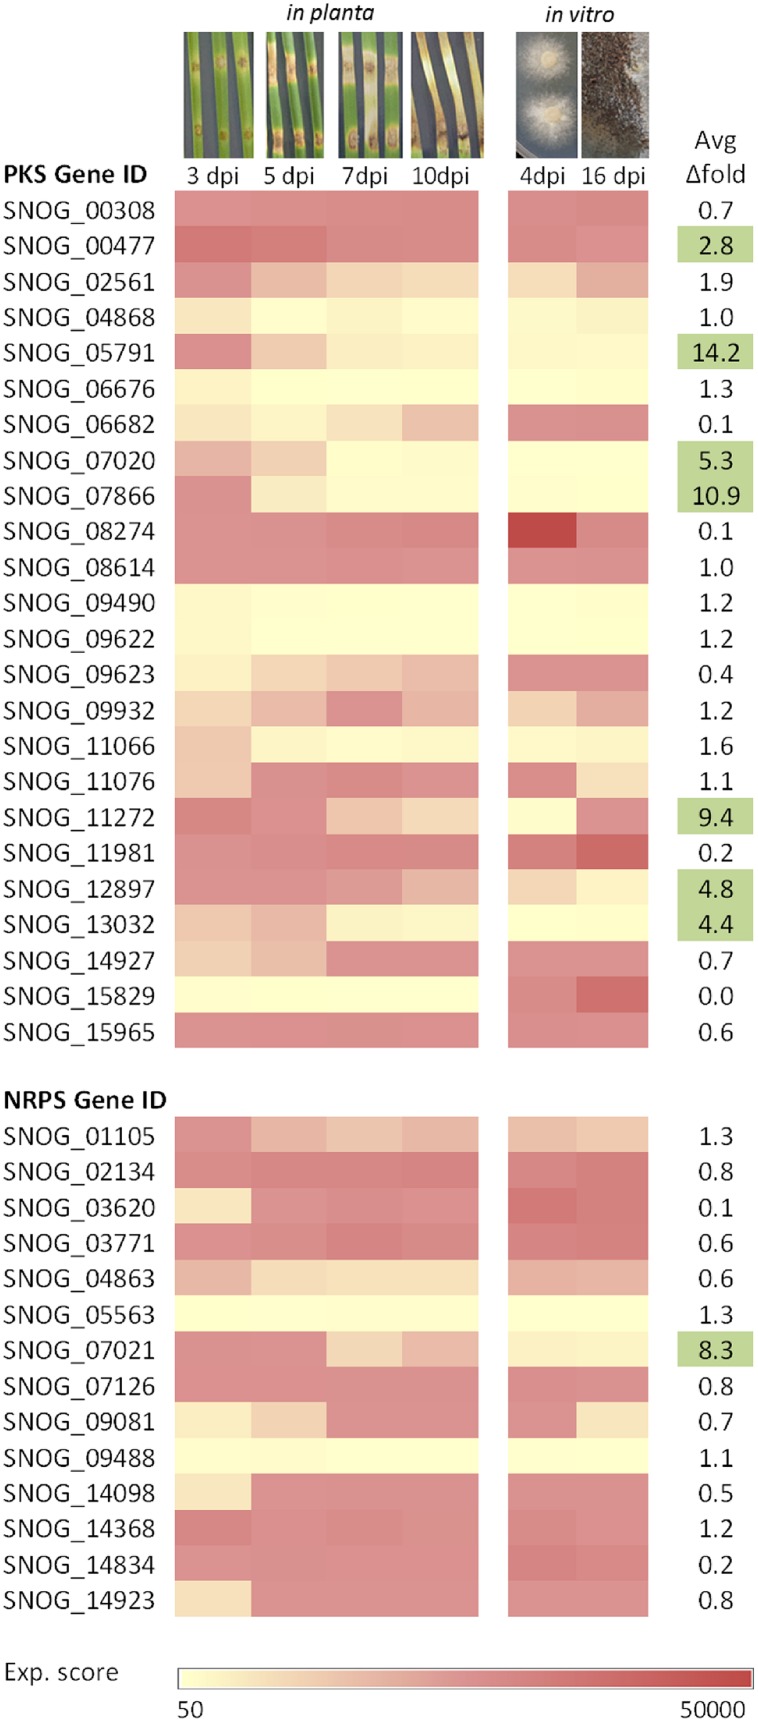
FIGURE 2.
Transcriptomic profiles of PKS and NRPS genes in P. nodorum on detached leaf assays (in planta) and during growth on minimal medium (in vitro). The microarray data is based on Ipcho et al. (2012). Expression scores were normalized: <500 essentially indicative of no expression, >50000 indicates massive expression (out of dynamic range). Average fold difference is calculated by dividing the average expression score in planta over the average in vitro (highlighted in green indicates > two-fold difference).

