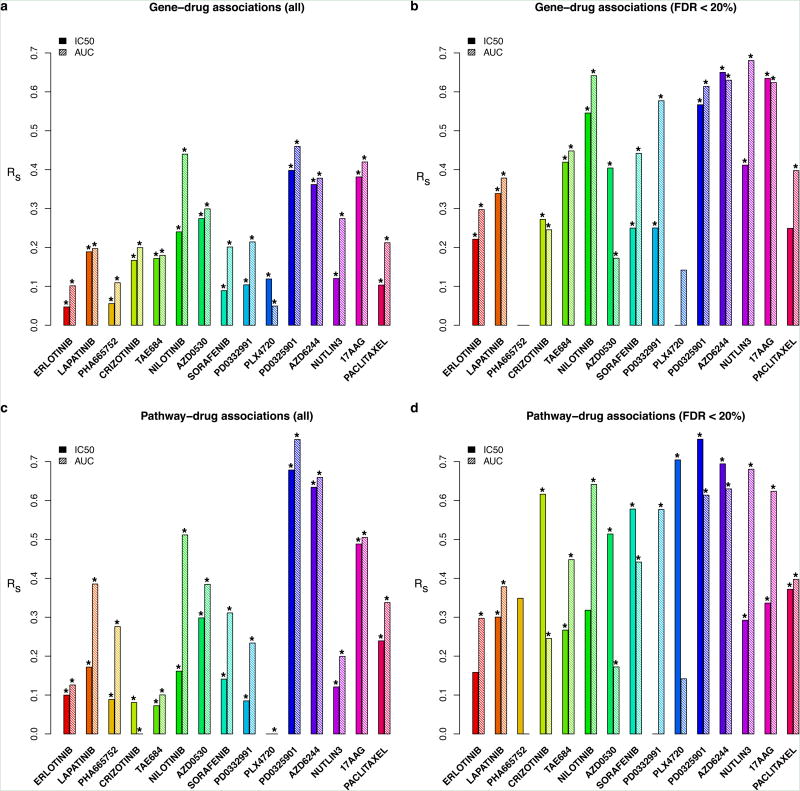
Figure 3.
Consistency of associations of genomics features with drug sensitivity. The bars represent the Spearman correlation coefficients computed from: (a) all and (b) significant (FDR<20%) gene-drug associations; (c) all and (d) significant (FDR<20%) pathway-drug associations, as estimated in CGP and CCLE datasets. Significance is reported using the symbol ‘*’ if two-sided p-value < 0.05.

