
Extended Data Figure 6.
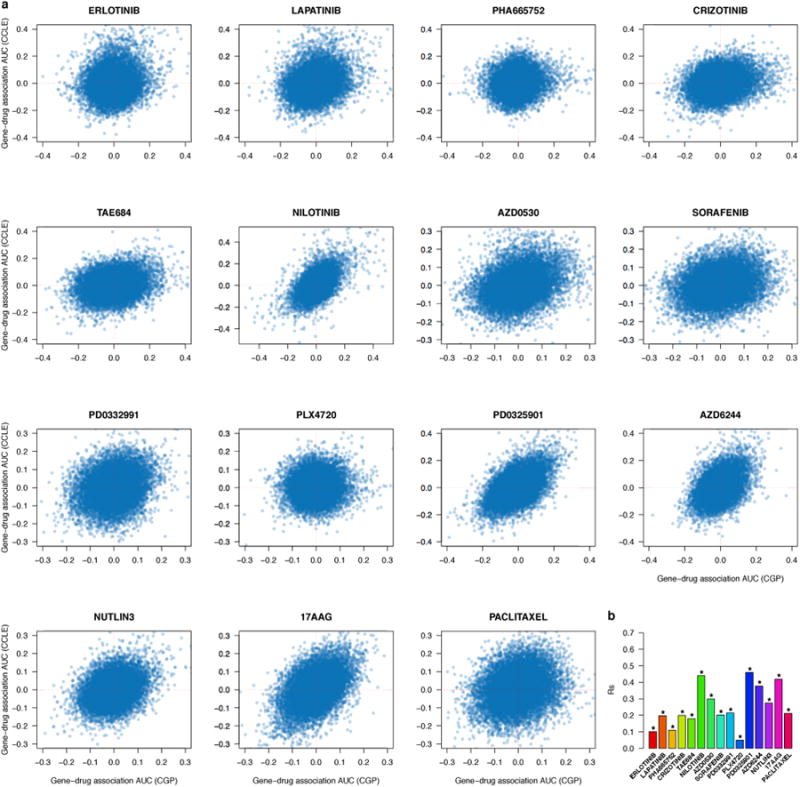
Scatter plots reporting the gene-drug associations computed with AUC, as quantified by the standardized coefficient of the gene of interest in a linear model controlled for tissue type, in the 471 cell lines and for each the 15 drugs investigated both in CGP and CCLE. The last bar plot (bottom right corner) reports the Spearman correlation coefficient (Rs) for each drug where significance of each correlation coefficient is reported using the symbol ‘*’ if two-sided p-value < 0.05.