
Figure 2. Error difference between patients and controls (Sound Localization task).
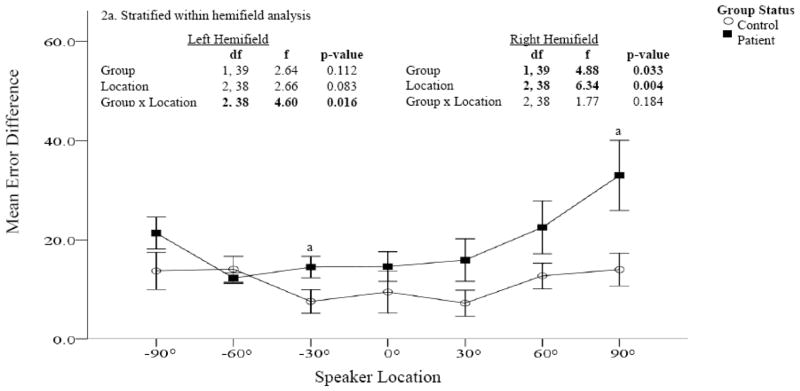
Accuracy was measured at each speaker location using error difference (the absolute difference between the actual and reported speaker location); greater error differences are indicative of poorer accuracy. Patients are represented by the dark squares and controls by the open circles. Significantly greater error differences were found in patients compared to controls, particularly in the right hemifield. Within hemifield analysis confirm significant differences in the right but not left hemifield (Figure 2a).