
Figure 4.
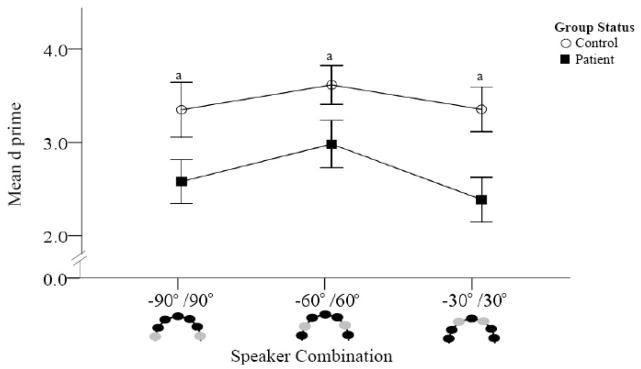
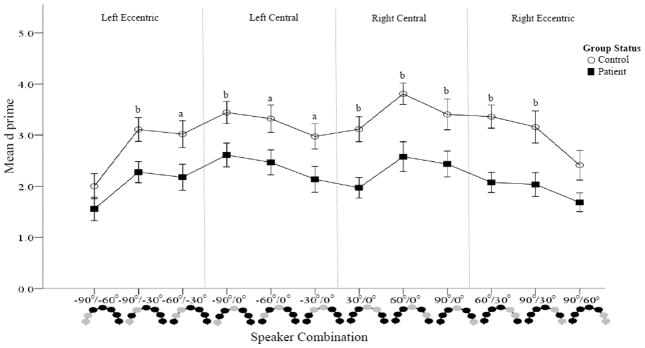
Figure 4a. Accuracy comparisons between patients and controls (Spatial Discrimination task).
D prime was calculated for each speaker combination. Higher d′ values are indicative of better accuracy. Combinations crossing the midline are presented. Schematic representations of the speakers are provided at the bottom of the figure with light colored circles representing the sound locations. Patients are represented by dark squares and controls by open circles. Poorer accuracy was found in patients compared to controls at all three speaker combinations.
Figure 4b. Accuracy comparisons between patients and controls (Spatial Discrimination task). D prime was calculated for each speaker combination. Higher d′ values are indicative of better accuracy. Within hemifield speaker combinations are presented. Schematic representations of the speakers are provided at the bottom of the figure with the light colored circles representing the sound locations. Patients are represented by dark squares and controls by open circles. With the exception of the most eccentric combinations, poorer accuracy was found in patients compared to controls at all speaker combinations.