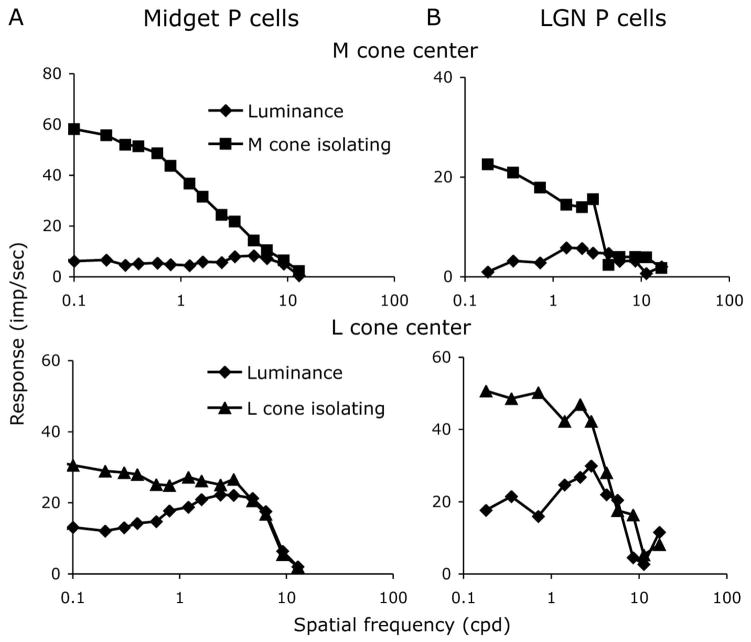
Fig. 2.
Spatial frequency tuning curves for luminance gratings and gratings isolating the receptive field center cone class for A, two midget ganglion cells and B, two LGN parvocellular cells. Responses for the retinal ganglion cells have been scaled relative to 30% cone contrast. Responses of the parvocellular cells were for ~20% contrast. The degree of bandpass shape for luminance varies from cell to cell, but for the gratings isolating the center cone class the curves have a low-pass shape.

