
Fig. 3.
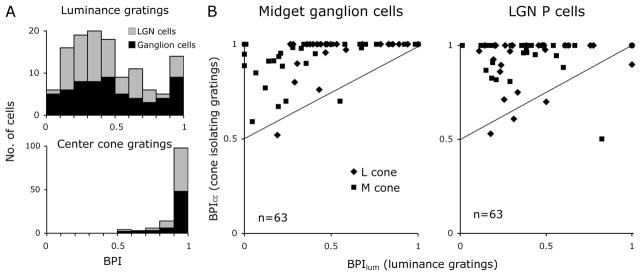
A, Distributions of BPIlum for luminance gratings and for the gratings isolating the receptive field center cone class (BPIcc) for populations of midget ganglion cells and of parvocellular LGN cells show considerable similarity. For luminance there is much variability of BPIlum, with some cells showing little low-spatial-frequency roll-off (BPIlum = 1). B, Comparisons of BPIlum and BPIcc for the two cell samples on a cell-by-cell basis. The solid curves represent the relationship between the BPI for luminance and the center cone expected if the M:L ratio were 1:1. See the text for the derivation.