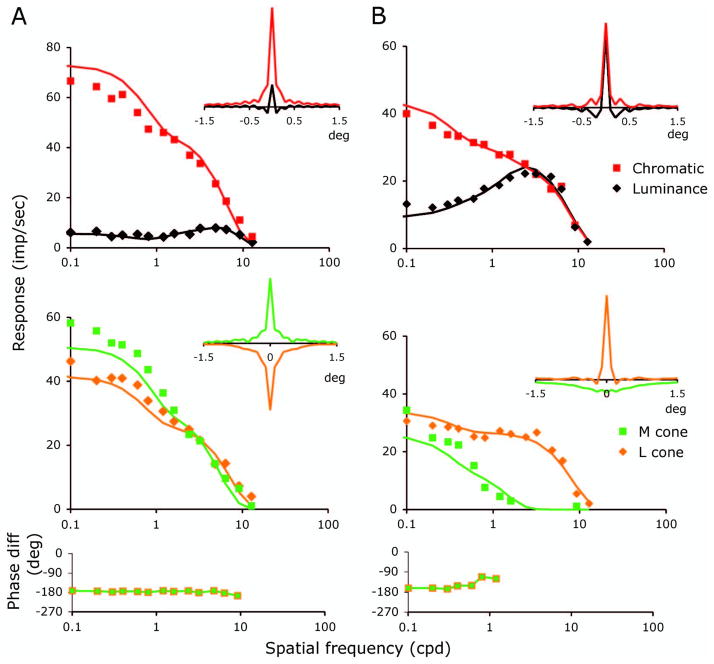
Fig. 4.
Tuning curves for the two ganglion cells of Fig. 2 for luminance and chromatic modulation (upper panels) and the cone-isolating conditions (middle panels). As in Fig. 2, the data have been contrast normalized. The phase plots in the the lower panels refer to the phase difference between the responses to the M and L-cone-isolating gratings and show a 180 deg phase difference. The inset figures indicate the inverse cosine transform of the response amplitude data for the different conditions. For the cell in A, the single cone transforms show sharp peaks set on a broad pedestal. For the cell in B, the curves resemble more closely those expected of a pair of Gaussian distributions. Solid curves are the fits for a model described in the text.

