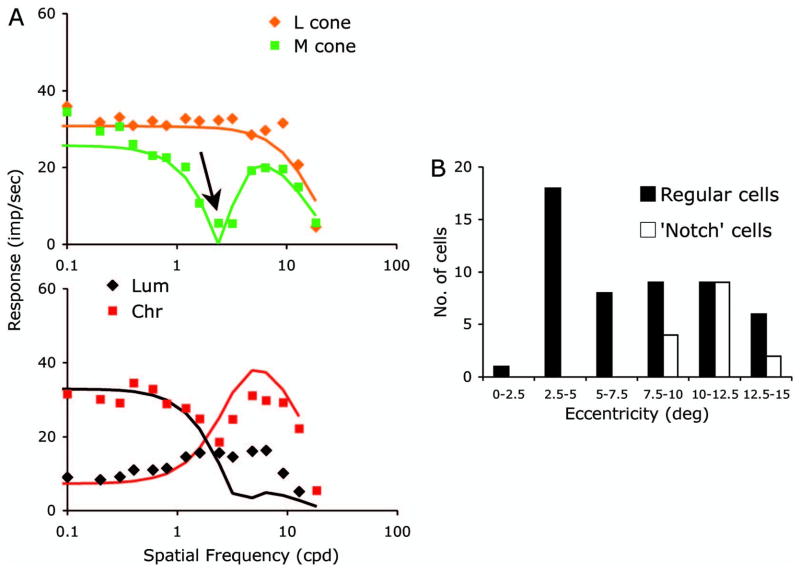
Fig. 6.
A, Examples of tuning curves from a neuron with a “notch” effect for one of the cone-isolating conditions (upper panel). The L-cone tuning curve is low-pass, but the M-cone shows a tuning curve with a minimum (arrow), followed by a further peak; such notches were associated with a phase change (>90 deg). Curves indicate fits of a DOG model. However, tuning curves for luminance and chromatic gratings were poorly predicted. Further details are in the text. B, Eccentricity distribution of ganglion cells; those showing a notch feature were at eccentricities of 10 deg or above.

