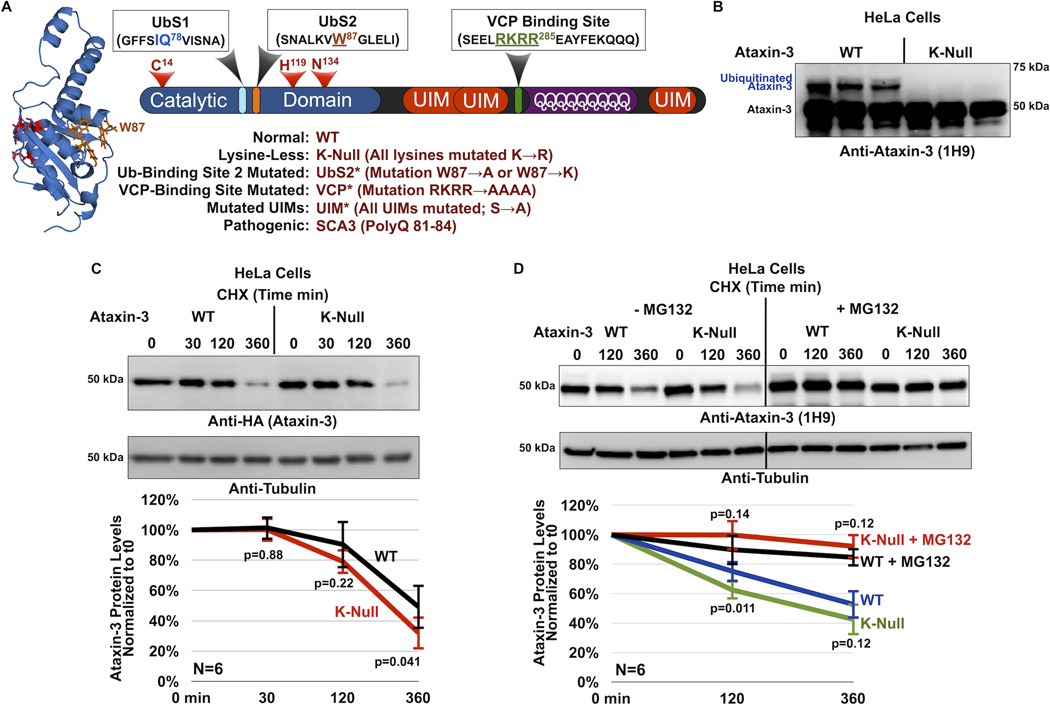
Figure 1. Cellular degradation of ataxin-3 does not require its own ubiquitination.
A) Schematic of ataxin-3. The catalytic triad (red) and two ubiquitin-binding sites (UbS1, light blue and UbS2, orange) are on the catalytic domain (blue). Next are three ubiquitin-interacting motifs (UIMs; red), separated by the polyglutamine (polyQ) region. Preceding the polyQ is the VCP-binding site (green). The NMR-based structure of the catalytic domain of ataxin-3 was reported in ref. [22]. The file for the structure depicted here was obtained from NCBI (PDB: 1YZB) and was rendered and annotated using the software application MacPyMOL. Legend: abbreviations used in this report.
B) Western blot of whole cell lysates. HeLa cells were transfected with the indicated constructs and treated with MG132 (6 hours, 15µM) 24 hours post transfection to enhance the capture of ataxin-3 ubiquitination, as we have described before26, 27. We previously showed through stringent immunopurification protocols and mass spectrometry that the more slowly migrating band of ataxin-3 is ubiquitinated ataxin-325, 26, 27, 28, 54. Equal total protein loaded (50µg/lane). Transfections were performed independently in triplicate. Overexposed blot to highlight ubiquitinated ataxin-3.
C) Top: Western blots of whole cell lysates. HeLa cells were transfected as indicated and treated for the specified amounts of time with cycloheximide (CHX) 48 hours post-transfection. Bottom: Means of ataxin-3 signal quantified from blots on the top and other similar experiments. P values are from Student T-tests comparing protein levels of K-Null ataxin-3 to the wild type counterpart. Error bars: standard deviations. N=6 independently conducted experiments.
D) Top: Western blots of whole cell lysates of HeLa cells transfected as indicated, treated or not for 2 hours with the proteasome inhibitor MG132 (10µM) 24 hours after transfection, then treated for the specified amounts of time with cycloheximide (CHX). Bottom: Means of ataxin-3 signal quantified from western blots on the top and other similar, independent experiments. P values are from Student T-tests comparing protein levels of K-Null ataxin-3 to the normal version of the protein. Error bars: standard deviations. N=6 independently conducted experiments.

