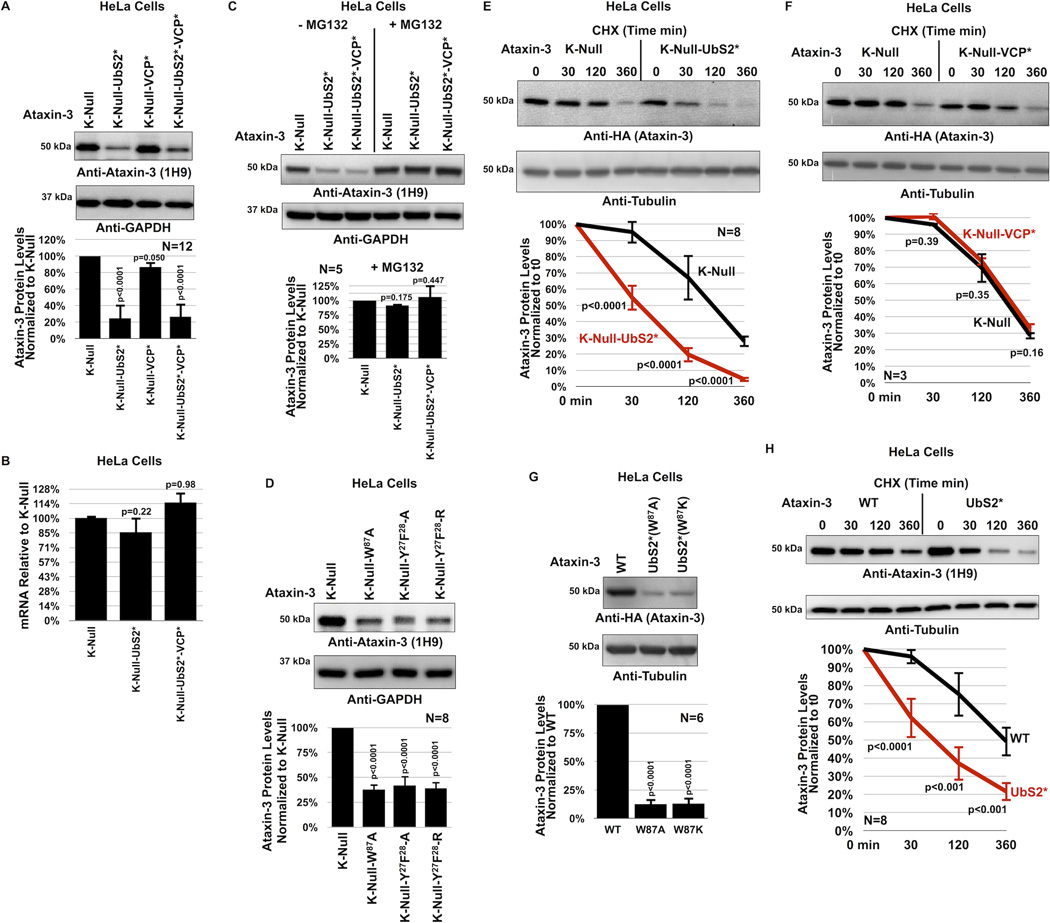
Figure 3. UbS2 of ataxin-3 regulates its degradation in cells.
A) Top: Western blots of whole cell lysates. HeLa cells were transfected as indicated and harvested 24 hours later. Bottom: Means of ataxin-3 signal quantified from blots on the top and other similar experiments. Error bars: standard deviations.
B) qRT-PCR of HeLa cells expressing the indicated constructs. Endogenous control: GAPDH. N=3 independently conducted experiments. Shown are mean ataxin-3 mRNA levels −/+ standard deviations.
C, D) Top: Western blots of whole cell lysates of HeLa cells transfected as indicated, treated or not with MG132 (4 hours, 15µM) 48 hours later and harvested. Bottom: Means of ataxin-3 signal quantified from blots on the top and other similar experiments. Error bars: standard deviations.
E, F) Top: HeLa cells were transfected as indicated and 24 hours later were treated with CHX for the specified amounts of time. For panel E, to have comparable protein amounts of both ataxin-3 versions at time 0 min, we transfected 3× more K-Null(UbS2*) construct than K-Null, which was supplemented with empty vector to equate total DNA per group. Western blots of whole cell lysates. Bottom: Means of ataxin-3 signal quantified from blots on the top and other independent experiments. Error bars: standard deviations.
G) Top: Western blots of whole cell lysates. Two different mutations were used to disrupt UbS2: W87A and W87K, with similar results. Bottom: Means of ataxin-3 signal quantified from blots on the top and other independent experiments. Error bars: standard deviations.
H) Top: HeLa cells were transfected as indicated and 24 hours later were treated with CHX for the specified time points. 3× more ataxin-3(UbS2*) construct was transfected than ataxin-3(WT) to have comparable protein levels at time 0 min. Bottom: Means of ataxin-3 signal quantified from blots on the top and other independent experiments. Error bars: standard deviations.
For panels A, B, C, D and G, P values are from ANOVA with Tukey post-hoc correction comparing the various versions of ataxin-3 to their panel controls. For panels E, F and H, P values are from Student t-tests. N of independently repeated experiments is specified in panels.

