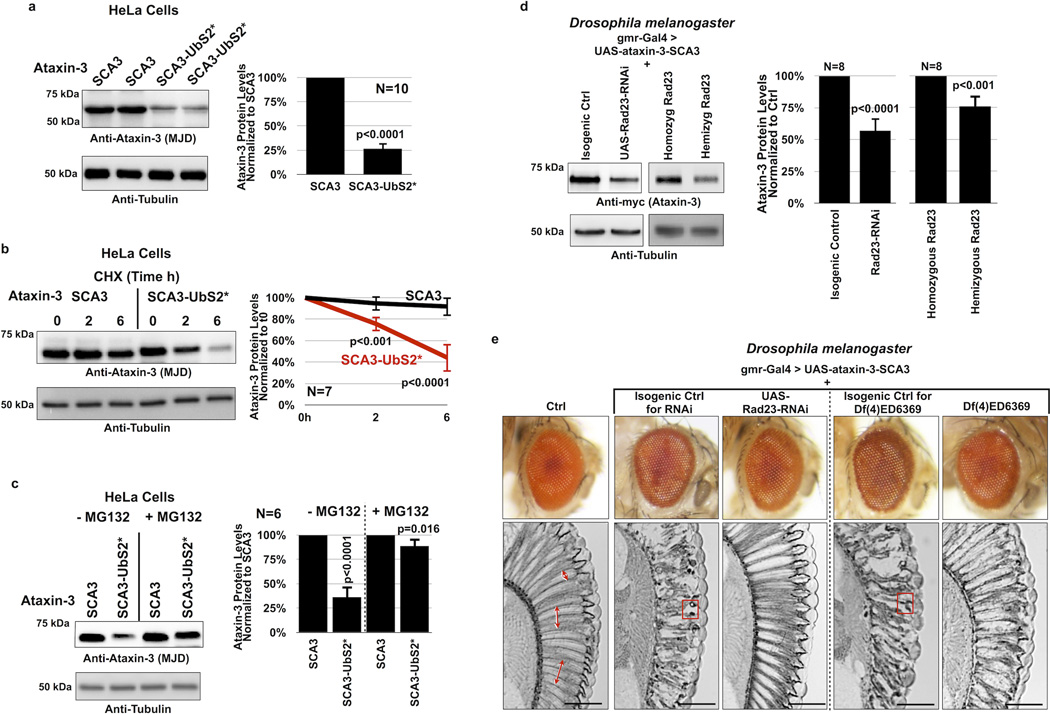
Figure 6. Turnover of pathogenic ataxin-3 protein is also regulated by UbS2.
A, C) Left: Western blots from HeLa cells transfected as indicated and treated or not with MG132 (4 hours, 15µM) 24 hours after transfection. Right: Means of ataxin-3 signal quantified from blots on the left and other similar experiments. P values are from Student T-tests. Error bars: standard deviations. N of independently conducted experiments is provided in the respective panels.
B) Left: Western blots of HeLa cells transfected as indicated and treated with CHX 24 hours later. Right: Means of ataxin-3 signal quantified from blots on the left and other similar experiments. P values are from Student T-tests. Error bars: standard deviations. N=7 independently conducted experiments.
D) Left: Western blots from at least 10 dissected fly heads for each indicated group. Right: Means of ataxin-3 signal quantified from blots on the left and other similar experiments. P values are from Student T-tests. Error bars: standard deviations. N=8 independent experiments. Flies were 1–2 days old. All flies were heterozygous for UAS-ataxin-3, UAS-Rad23-RNAi (where indicated), and the gmr-Gal4 driver.
E) External photos and internal sections of fly eyes expressing UAS-ataxin-3(SCA3) in the isogenic background of the UAS-RNAi line targeting Rad23 (2nd column), with UAS-RNAi targeting Rad23 (third column), in the isogenic background of Rad23 deficiency (4th column, which is the control for column 5; see main text for description), or in the presence of one copy of Rad23 (deficiency line; 5th column). Driver: gmr-Gal4. Double headed arrows: ommatidial boundaries. Boxes: proteinaceous inclusions that contain ataxin-3(SCA3)6. Control in 1st column contained only gmr-Gal4. The other lines were heterozygous for the gmr-Gal4 driver and UAS-transgenes. Images are representative of sections from at least six flies per group and experiments were conducted independently in triplicate with similar results. Flies were 14 days old. Scale bars in histological sections: 50µM.

