
Figure 2. Hsp70i-/- mice sustain increased brain injury post-TBI.
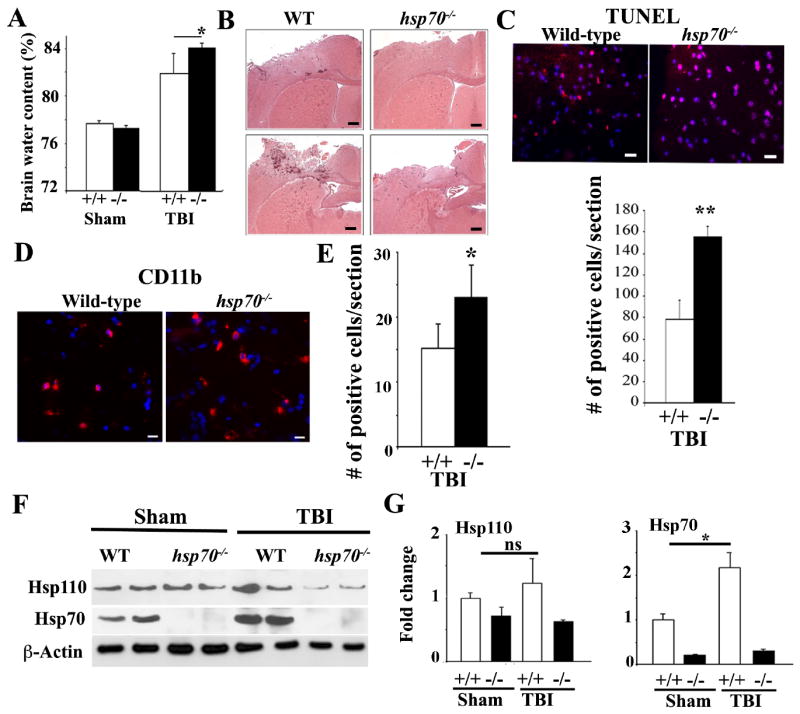
WT (+/+) and hsp70i-/- (-/-) mice were subjected to CCI or were sham-treated and analyzed 24 hours post-TBI.
(A) Brain water content was quantified from the ipsilateral cortex post-TBI. Data are presented as mean+/-SD (n=5 mice).* p<0.05.
(B) Representative photographs of coronal brain sections stained with H&E post-TBI. Scale Bars: 200 μm.
(C) Apoptotic cells in the cortical region close to the injured site (-0.1mm to -1.58mm bregma) are presented. Scale bar: 20 μm. Quantification of the TUNEL-positive cells in (lower panel) is presented in the lower panel. Data are presented as mean+/-SD.** p<0.01.
(D-E) IHC analyses of CD11b-positive cells post-TBI (-0.1mm to -1.58mm bregma). Scale bar:10μm. Quantification of the CD11b-positive cells is presented in panel E. Data is presented as mean+/-SD.* p<0.05.
(F-G) Immunoblotting analyses showing sham or TBI-treated brain cell lysates of cortical regions using the indicated antibodies. β-actin is loading control. Quantification of the immunoblots is presented in (G). Data are presented as mean+/-SD.*p<0.05, ns=not significant.
In all panels, DAPI (blue) represents nuclei staining. In panels B to G, n=3-5 mice per group.