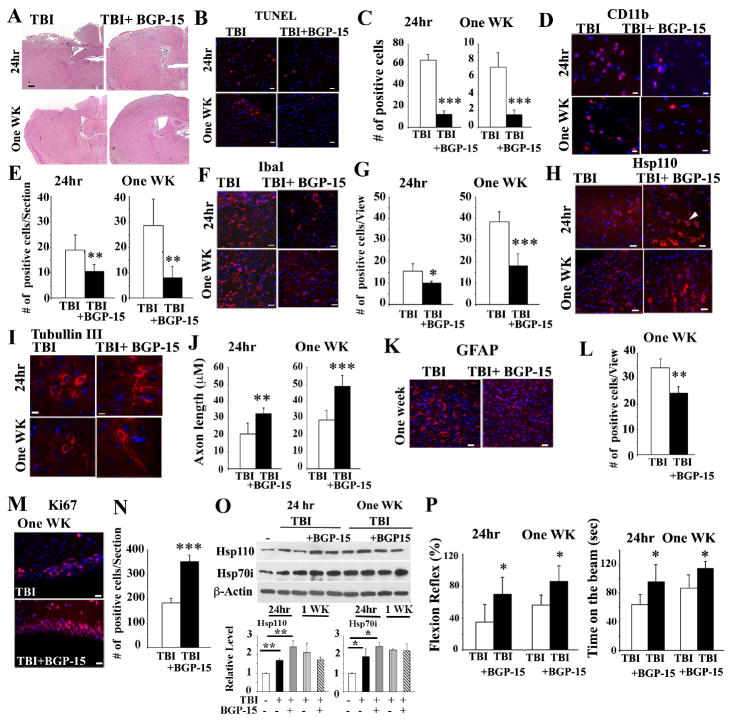
Figure 5. BGP-15 treatment of mice leads to improved post-TBI response.
WT mice were treated with TBI and received vehicle or BGP-15 immediately before (0 hour) and at 6, 24, 48, 72, 96 and 120 hours post-TBI. 24 hours group only received the first two treatments.
(A) Representative photographs of coronal brain sections stained with H&E. Scale Bars: 200 μm.
(B-C) Apoptotic cells in the cortical region close to the injured site (-0.1mm to −1.58mm bregma) are presented. Scale bar:10μm. Quantification of apoptotic cells post-TBI (C). Data is presented as mean +/- SD. ***p<0.001.
(D-E) Representative IHC staining of CD11b-positive cells in the cortical region (-0.1mm to −1.58mm bregma) are presented. Scale bar: 10 μm. Quantification of CD11b-positive cells is presented in (E). Data presented as mean +/- SD.** p<0.01.
(F-G) Representative IHC staining of Iba1-positive cells in the cortical region (-0.1mm to −0.94mm bregma) are presented. Scale bar=10μm. Quantification of IbaI-positive cells is presented in (G). Data presented as mean+/- SD. *p<0.05, ***p<0.001.
(H) Representative IHC staining of Hsp110-positive cells in the cortical region (-0.1mm to −0.94mm bregma) are presented. Scale bar=10μm.
(I-J) Representative IHC staining of β-Tubulin III in the cortical region (-0.58mm to −0.94mm bregma) are presented. Scale bar=10 μm. Quantification of axon-length is presented in (J). Data presented as mean +/- SD. **p<0.01, *** p<0.001.
(K-L) Representative IHC staining of GFAP-positive cells in the cortical region (-0.1mm to -0.94mm bregma) are presented. Scale bar=10 μm. Quantification of GFAP-positive cells is presented in (L). Data presented as mean +/- SD. ** p<0.01.
(M-N) Representative IHC staining of Ki67-positive cells is presented. Scale bar=10μm. Quantification of Ki67-positive cells is presented in (N). Data presented as mean +/- SD. ***p<0.001.
(O) Immunoblotting analyses of cortical region close to the injured site (3mm coronal of the ipsilateral cortex centered around the impact site) using the indicated antibodies. Brain cell lysates from two treated mice are presented. (-) untreated brain cell lysates. Quantification of the immunoblots is presented in the lower panels. Data presented as mean +/- SD.*p<0.05,**p<0.01.
(P) Flexion reflex and time spent on the beam were measured in mice post-TBI. Data is presented as mean +/- SD (n=8 mice). *p<0.05.
In all panels, DAPI (blue) represents nuclei staining. In panels A to O, n=3-5 mice per group.

