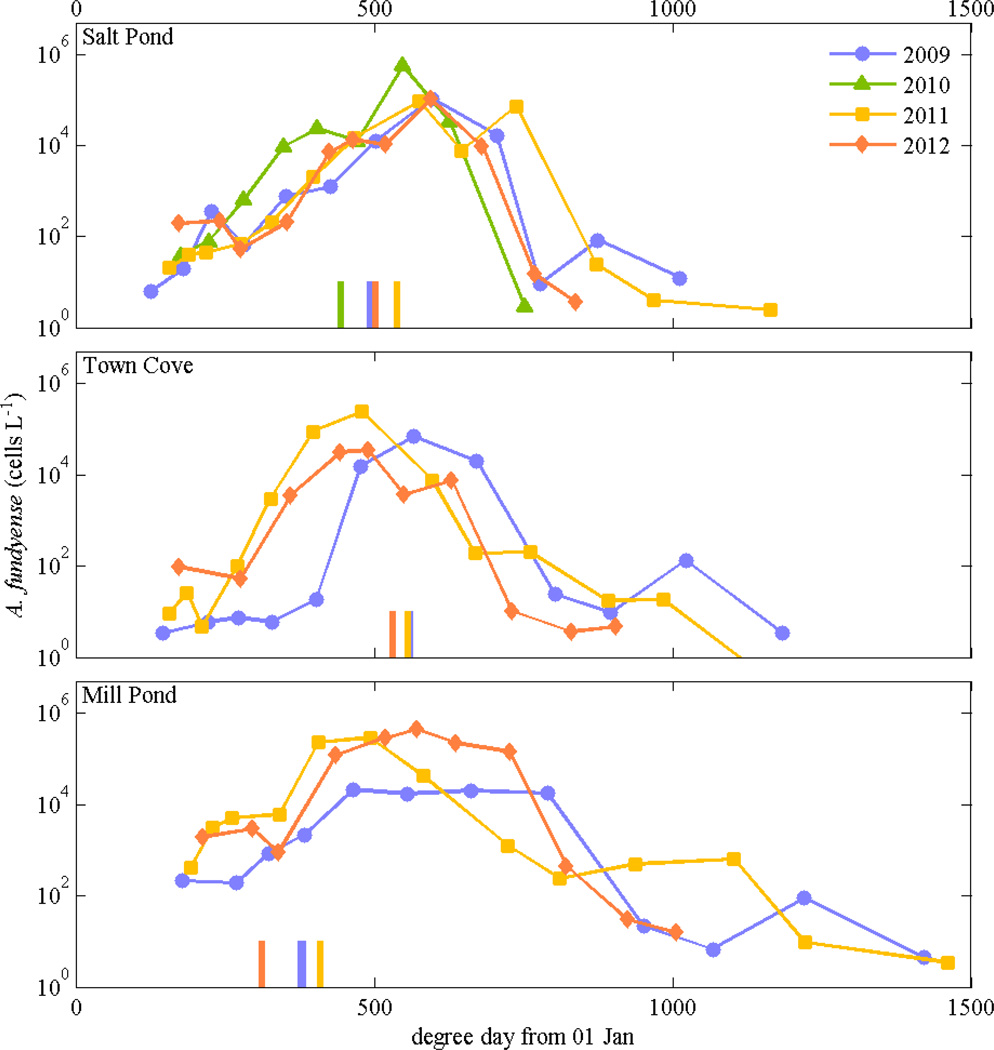
Figure 10.
A. fundyense concentrations in Salt Pond, Town Cove, and Mill Pond vs. degree day, assuming Tbase = 0°C and starting the integration 01 January each year. Degree day was calculated from moored instruments in each pond, plus using temperature data from Waquoit Bay prior to instrument deployment in Nauset. Cell concentrations were from weekly surveys in 2009 through 2012; only Salt Pond had observations in 2010. Vertical bars at the bottom of each plot indicate degree day on the date that toxicity sampling at each location exceeded the regulatory threshold of 80 µg toxin per 100 g mussel tissue (MA Division of Marine Fisheries).

