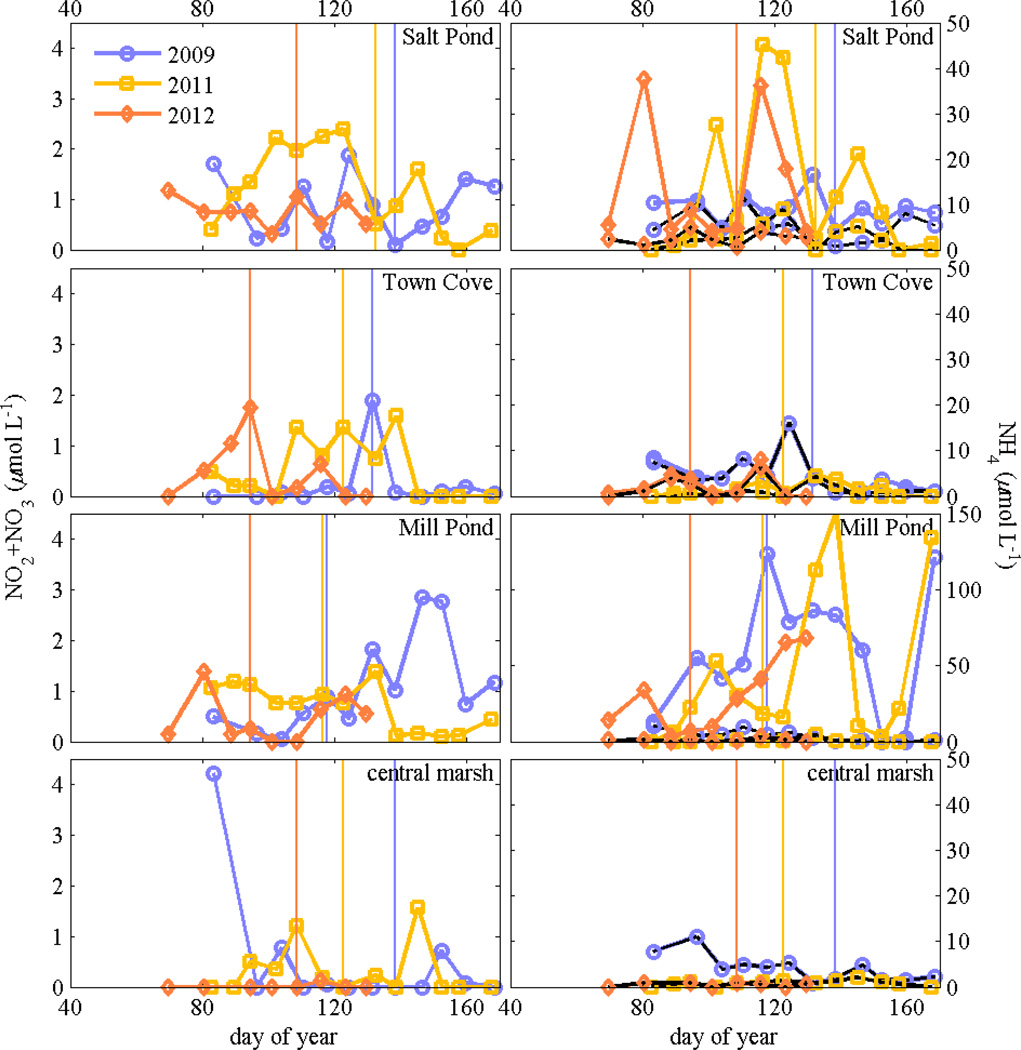
Figure 8.
Maximum nitrate plus nitrite concentrations (left panels) and ammonium concentrations (right) at stations in Salt Pond, Town Cove, Mill Pond, and the central marsh (Hemenway) from weekly surveys in 2009, 2011, and 2012. Note the scale is different for ammonium in Mill Pond. Minimum ammonium concentrations are also shown with black lines. Vertical lines denote when maximum cell concentrations were observed at each location.

