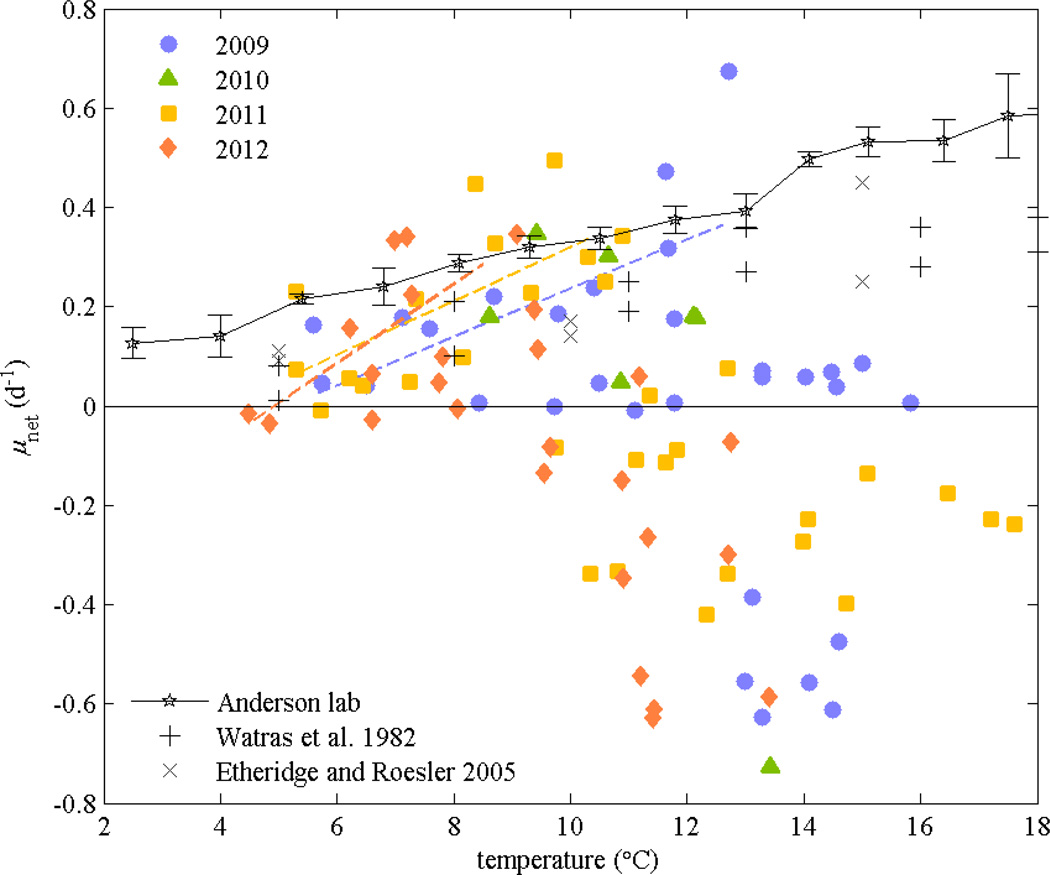
Figure 9.
Net growth rates from observed A. fundyense concentrations vs. temperature in Salt Pond, Town Cove, and Mill Pond from weekly surveys, based on a 3 week moving window. Trend lines are shown from linear regressions for data prior to the bloom peaks when grazing and encystment losses are expected to be minor. For comparison, A. fundyense growth rates from laboratory studies are also shown (Watras et al. 1982; Etheridge and Roesler 2005; D.M. Anderson unpubl. data).

