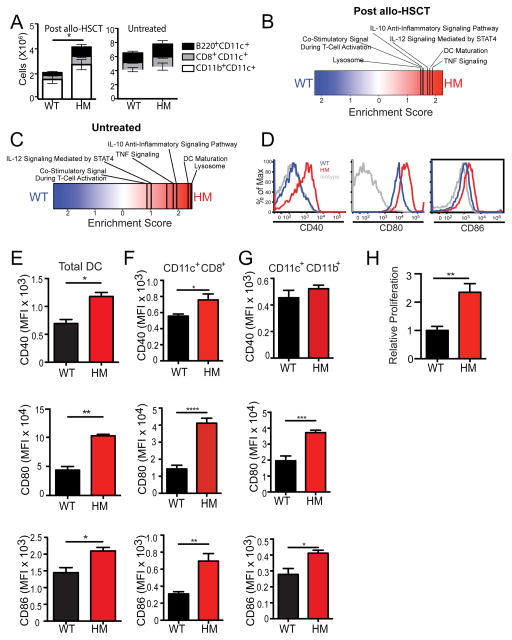
Figure 3. DC activation is enhanced in Atg16L1-deficient allo-HSCT recipients.
(A) Lethally-irradiated WT and Atg16L1HM mice received TCD-BM and 2×10⁶ T cells from B10.BR mice as in previous figures, and flow cytometry was used to quantify CD11c+B220+, CD11c+ CD8+, and CD11b+CD11c+ DC subsets in the spleen on day 7. Similar quantification was performed on splenic DCs from untreated mice. (B–C) Microarray analyses was performed on RNA extracted from purified splenic CD11c+ cells from either (B) allo-HSCT recipients on day 7 or (C) untreated mice as in (A). Enrichment score from GSEA shown. Extended analyses provided in Table S2. n = 3–4 biological replicates each. (D) Representative histograms of CD40, CD80, and CD86 cell surface expression on total CD11c+I-AE+ recipient DCs detected by flow cytometry on day 7 after allo-HSCT. (E–G) Quantification of CD40, CD80 and CD86 (MFI) from the flow cytometry analysis in (D) gated on (E) total CD11c+, (F) CD8+CD11c+, and (G) CD11b+ CD11c+ cells. (H) Purified CD11c+ cells from WT and Atg16L1HM recipient mice were co-cultured with B10.BR T cells at a 1:1 ratio for 72 hrs and proliferation was determined by 3H-thymidine incorporation. Bar graphs show mean ± S.E.M. and represent at least 5 mice/group. *P < 0.05, **P < 0.01, ***P < 0.001, ****P < 0.0001.

