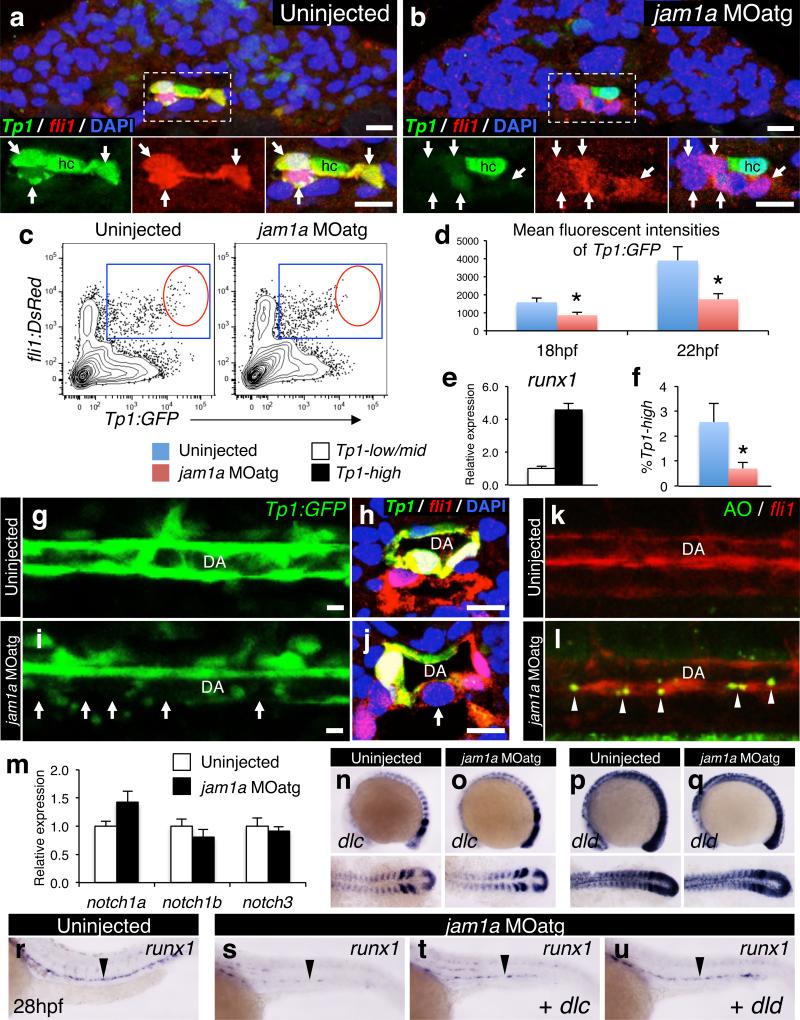
Figure 4. Notch signalling is depleted in jam1a morphants.
a, b, Transverse sections of Tp1:GFP; fli1:DsRed embryos uninjected or injected with jam1a MOatg at 18hpf. Green and red channels and merges of the boxed regions are shown in the lower panels. Arrows indicate fli1:DsRed+ cells. hc, hypochord. c-f, Flow cytometric and gene expression analysis of Tp1:GFP; fli1:DsRed embryos. Representative results of flow cytometric analysis at 22hpf (c), the mean fluorescent intensities of GFP in Tp1:GFP+; fli1:DsRed+ populations (d), relative expression levels of runx1 in the Tp1:GFPhigh and Tp1:GFPlow/mid population of fli1:DsRed+ cells in wild type embryos at 22hpf (e), and the percentages of Tp1:GFPhigh in fli1:DsRed+ populations at 22hpf (f) are shown. Blue gates and red circles indicate the Tp1:GFP+; fli1:DsRed+ and Tp1:GFPhigh; fli1:DsRed+ population, respectively. *p < 0.01, by Student's t-test; Error bars, s.d. g-j, Lateral views of the dorsal aorta (DA) in Tp1:GFP embryos and transverse sections of Tp1:GFP; fli1:DsRed embryos uninjected or injected with jam1a MOatg at 28hpf. Arrows indicate relatively low activation of Tp1:GFP in the ventral floor of the DA. Bars, 10μm. k, l, Acridine orange (AO) staining under the fli1:DsRed background in uninjected or jam1a MOatg-injected embryos at 30hpf. Arrowheads indicate AO-stained apoptotic cells. m, Relative expression levels of notch1a, notch1b, and notch3 in purified fli1:GFP+ cells obtained from uninjected or jam1a MOatg-injected embryos at 18hpf. n-q, The expression of dlc and dld in uninjected or jam1a MOatg-injected embryos at 14hpf. r-u, The expression of runx1 at 26hpf. Embryos were uninjected, injected with jam1a MOatg alone, or co-injected with jam1a MOatg and dlc or dld mRNA. Data are representative of two independent experiments with four embryos (a, b, h, j), eight embryos (g, i, k, l), four different clutches of embryos (c-f), or two different clutches of embryos (m-u).

