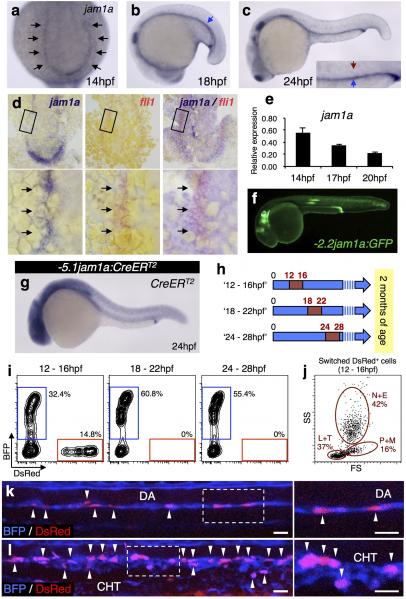
Extended Data Figure 2. The expression of jam1a and lineage tracing of jam1a- expressing cells.
a-c, The expression of jam1a at 14, 18, and 24hpf. Black, blue, and red arrows indicate the posterior lateral mesoderm (PLM), pronephros, and dorsal aorta (DA), respectively. d, Single or two-color whole-mount in situ hybridization with jam1a (purple) and/or fli1 (red) probes. The expression domain of fli1 merged with that of jam1a (arrows). e, qPCR analysis of jam1a in purified fli1:GFP+ cells at 14, 17, and 20hpf. Relative expression levels in each cell population were calculated from the expression levels in the kidney tissue. Error bars, s.d. f, GFP expression of -2.2jam1a:GFP at 30hpf. GFP expression was strongly detected in posterior pronephros, lateral lines, and otic vesicles. g, The expression of CreERT2 in -5.1jam1a:CreERT2 at 24hpf. h. Three different schedules of 4-hydroxytamoxifen (4OHT) treatment (12 - 16hpf, 18 - 22hpf, and 24 - 28hpf) in -5.1jam1a:CreERT2; bactin2:loxP-BFP-loxP-DsRed (blue-to-red reporter line). The numbers indicate hour post fertilization (hpf), and red insets in the blue arrows indicate the period of the 4OHT treatment. i, Flow cytometric analysis of kidney marrow cells in 12 - 16hpf group (left, n = 5), 18 - 22hpf group (middle, n = 5), and 24 - 28hpf group (right, n = 2) at 2 months of age. One 12 - 16hpf animal showed switched DsRed+ cells in kidney marrow cells. j, DsRed+ cells from 12 - 16hpf kidneys are distributed in all blood cell populations, including neutrophils and eosinophils (N+E), precursors and monocytes (P+M), and lymphocytes and thrombocytes (L+T). k, l, Confocal imaging of the DA and caudal haematopoietic tissue (CHT) in a 12 - 16hpf embryo at 48hpf. Right panels show high magnification views of the boxed regions in left panels. Embryos are oriented with anterior to the left. There are many ‘switched’ DsRed+ cells in the ventral floor of the DA and in the CHT (arrowheads). Bars, 20μm. Data are representative of two independent experiments with two different clutches of embryos (a-e, g) or eight embryos (k, l) or pooled from two independent experiments (i, j).

