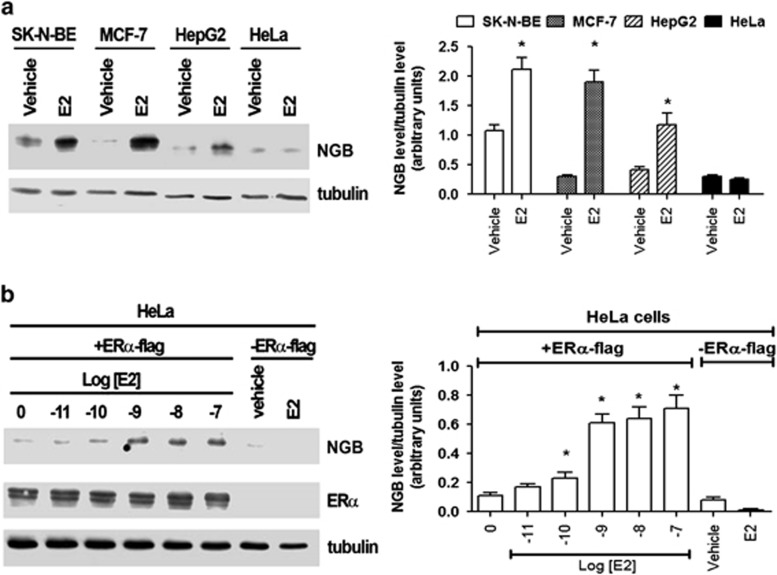
Figure 1.
NGB level in cancer cells. (a) The effect of E2 (1–10 nM; 24 h stimulation) on NGB protein levels in SK-N-BE, MCF-7, HepG2, and HeLa cells. (b) The E2 dose-dependent effect (0.01–100 nM; 24 h stimulation) on NGB level in HeLa cells transfected with pcDNA ERα-flag. The amount of protein was normalized by comparison with tubulin levels. The data are typical western blots of three independent experiments and the relative densitometric analyses. Data are means±S.D. of three different experiments. P<0.001 was determined with ANOVA followed by Tukey–Kramer post-test versus vehicle or 0 (ethanol/PBS 1 : 10, v/v) (*)

