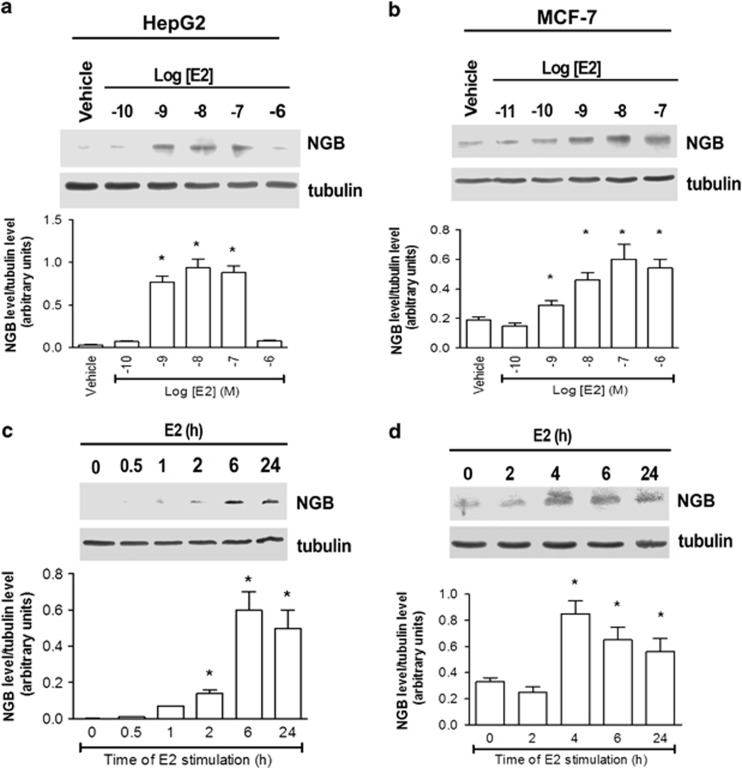
Figure 2.
Effect of E2 on NGB protein levels in HepG2 and MCF-7 cells. Western blot analysis of E2 dose-dependent effect (0.1–1000 nM) on NGB levels after 24 h of stimulation in (a) HepG2 and (b) MCF-7 cells. Time-course analysis of E2 treatment (10 nM) on NGB level in (c) HepG2 and (d) MCF-7 cells on NGB level. The amount of protein was normalized by comparison with tubulin levels. Top panels are typical western blots of three independent experiments. Bottom panels represent the results of the densitometric analyses

