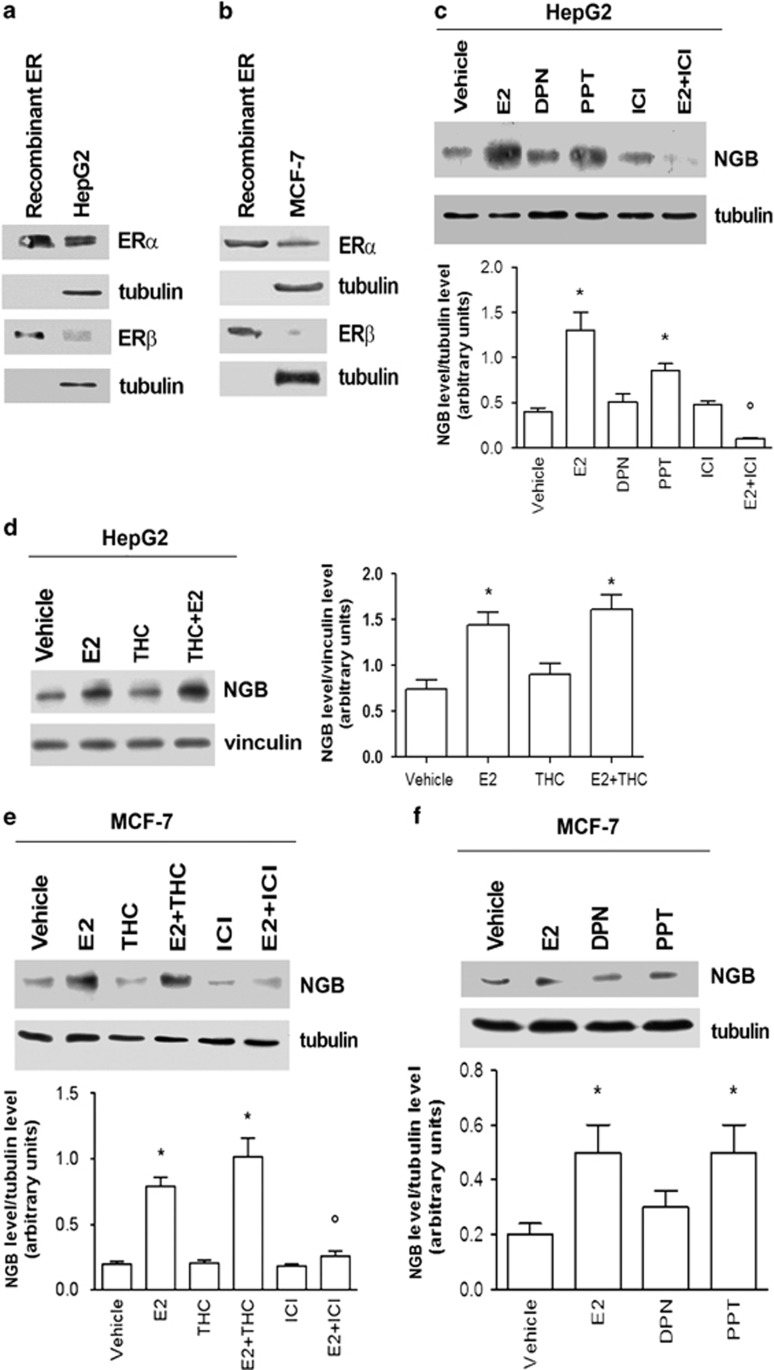
Figure 3.
Impact of estrogen receptors on NGB protein expression in HeLa, HepG2, and MCF-7 cells. Western blot of ERα and ERβ levels in non-stimulated cells compared with 5 ng of recombinant proteins in (a) HepG2 cells and (b) MCF-7 cells. (c) Western blot of NGB levels in HepG2 cells stimulated for 24 h with vehicle, E2 (10 nM), ERβ agonist DPN (10 nM), ERα agonist PPT (10 nM) or the ER inhibitor ICI (1 μM) in the absence and presence of E2 (10 nM). (d) Western blot of NGB levels in HepG2 cells stimulated for 24 h with vehicle, E2 (10 nM) or ERβ inhibitor THC (1 μM) in the absence and presence of E2 (10 nM). (e) Western blot of NGB levels in MCF-7 cells treated for 24 h with vehicle, E2 (10 nM), ERβ inhibitor THC (1 μM) or ER inhibitor ICI (1 μM) in the absence and presence of E2 (10 nM). (f) Western blot of NGB levels in MCF-7 cells stimulated for 24 h with vehicle, E2 (10 nM), ERβ agonist DPN (10 nM) or ERα agonist PPT (10 nM). The amount of proteins was normalized by comparison with tubulin or vinculin levels. (a,b) The data are typical western blots of three independent experiments. (c–f) Top panels are typical western blots, bottom panels represent the results of the densitometric analysis. Data are means±S.D. of three different experiments. P<0.001 was determined with ANOVA followed by Tukey–Kramer post-test versus vehicle (*) and versus E2-treated sample (°)

