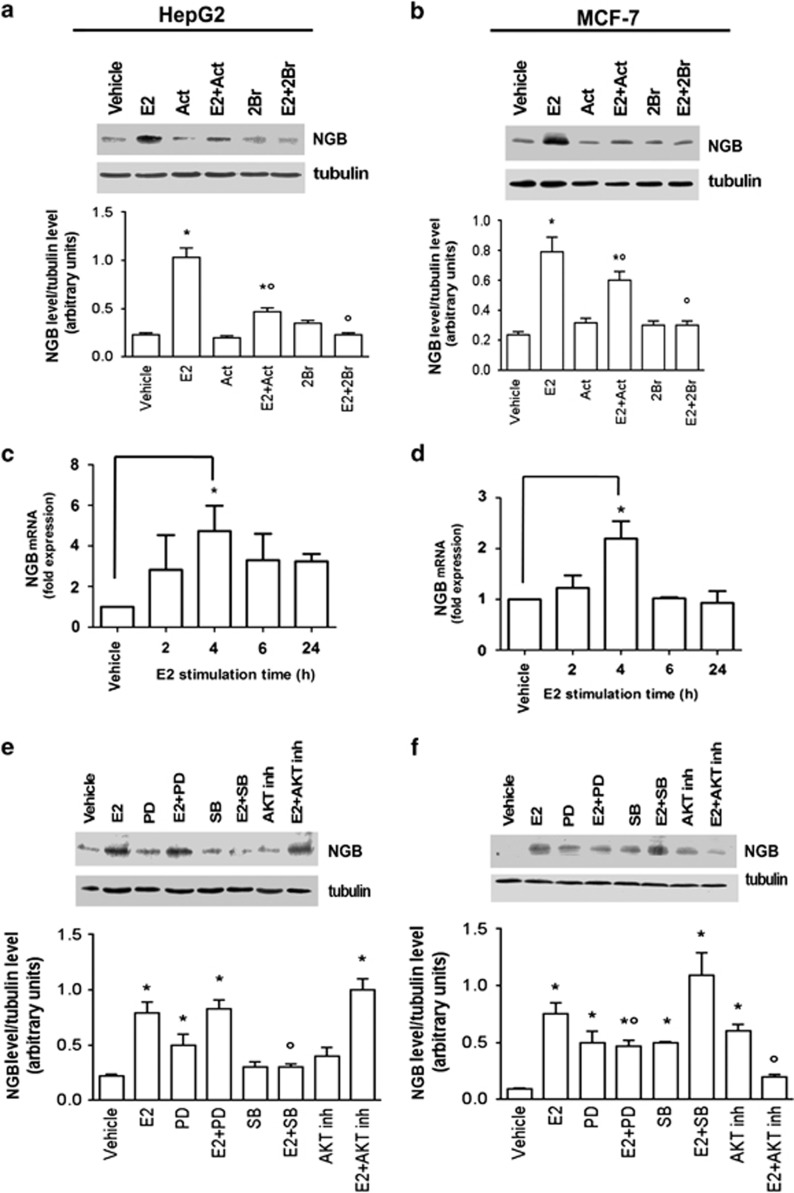
Figure 4.
Impact of ER genomic and membrane started signals on NGB protein expression. Analysis of NGB levels in HepG2 (a) and MCF-7 (b) cells stimulated for 24 h with vehicle, E2 (10 nM) and/or the transcription inhibitor Act (1 μg/ml) and/or the PAT inhibitor 2-Br (10 μM). Analysis of NGB protein levels in (e) HepG2 and (f) MCF-7 cells treated for 24 h with vehicle, p38 inhibitor SB-203580 (SB; 5 μM) or AKT inhibitor (5 μM) or ERK 1/2 inhibitor PD (10 μM) in the absence or presence of E2 (10 nM). The amount of proteins was normalized by comparison with tubulin levels. Top panels are typical western blots of three independent experiments. Bottom panels represent the results of the densitometric analysis. Data are means±S.D. of three different experiments. P<0.001 was determined with ANOVA test versus vehicle (*) and versus the E2-treated sample (°). Time course of E2 (10 nM) effect on NGB mRNA levels in (c) HepG2 and (d) MCF-7 cells. The NGB expression is expressed as fold of induction over the vehicle (set to one). Data represent the mean±S.D. of five different experiments. Significant differences (P<0.001) were determined by ANOVA followed by the Tukey–Kramer post-test with respect to unstimulated samples (*)

