Figure 5.
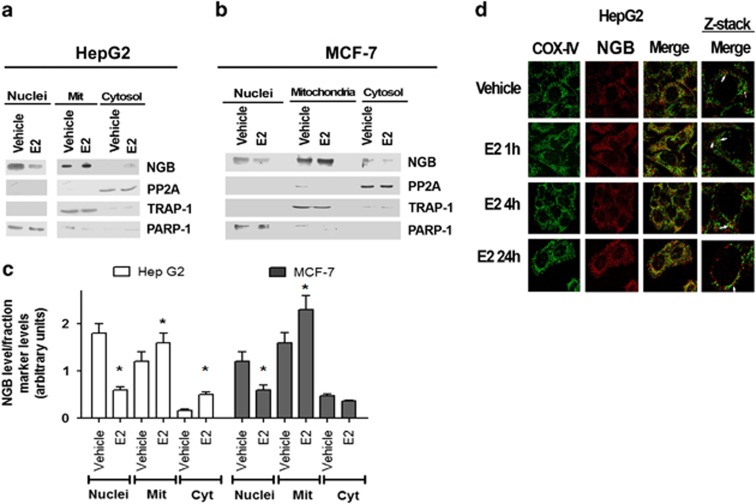
Effect of E2 on the localization of NGB in HepG2 and MCF-7 cells. Western blot of NGB level in nuclear (Nuclei), cytosolic (Cyt), and mitochondrial (Mit) fractions of (a) HepG2 and (b) MCF-7 cells and related densitometric analyses (c). The purity of fractions was assessed with PARP-1, TRAP1, and PP2A with respect to nucleus, mitochondria, and cytosol, respectively. The amount of proteins was normalized to each fraction marker protein. The figure represents a typical western blot of three independent experiments. Data reported in panel c represent the mean±S.D. of three different experiments. Significant differences (P<0.001) were determined by ANOVA followed by the Turkey–Kramer post-test with respect to unstimulated samples (*). (d) Confocal microscopy analysis of NGB and COX-4 co-immuno-localization. Cells were fixed, permeabilized, and stained with anti-NGB antibody (red) and co-stained with anti-COX4 antibody (green) (original magnification × 63). Merged images by confocal microscopy show NGB distribution in HepG2 cells treated with either vehicle or E2 (10 nM) for 1, 4, and 24 h. White arrows point to examples of NGB and COX-4 co-staining in a single Z-stack plane. Representative images from three different experiments are shown

