Figure 3.
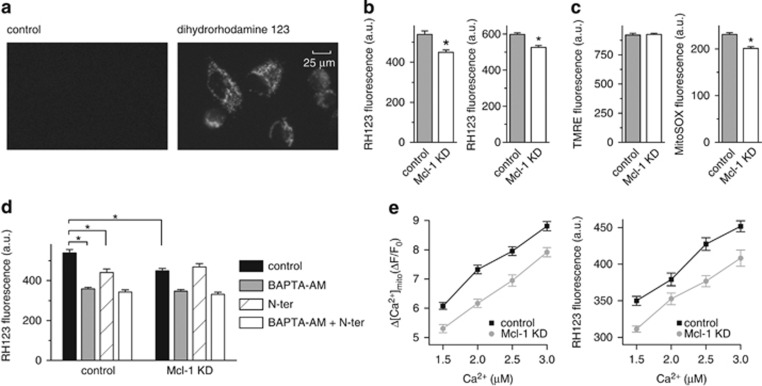
Mcl-1 increases reactive oxygen species (ROS) production in A549 cancer cells by increasing [Ca2+]mito. (a) Representative images showing fluorescence signal from A549 cells before and after loading with the ROS indicator dihydrorhodamine 123. (b) Summary bar graphs showing the mean±S.E. (300–400 cells, pooled from three independent experiments; *P<0.05, student's t-test) fluorescence signal arising from rhodamine 123 (RH123), the oxidation product of dihydrorhodamine, in A549 cells transfected with control and Mcl-1 siRNA and imaged after equilibration in normal external solution (left bar graph), or after equilibration with 0.5 mM CDNB (right bar graph). (c) Summary data for fluorescence imaging performed in control and Mcl-1 siRNA-treated A549 cells after equilibration in normal external solution. Bar graphs depict the mean±S.E. (300–400 cells, pooled from three independent experiments; *P<0.05, student's t-test) fluorescence signal from A549 cells loaded with the mitochondrial membrane potential indicator TMRE (left) and the mitochondrial ROS indicator MitoSox (right). (d) Summary bar graphs showing RH123 fluorescence recorded in control or Mcl-1 siRNA-treated A549 cells in the absence and presence of VDAC-based peptide (N-ter; 2 μM) alone, BAPTA-AM (25 μM) alone or N-ter and BAPTA-AM in combination. Data represent mean±S.E. of ≥300 cells pooled from three independent experiments (*, P<0.05; ANOVA). (e) Amplitude of [Ca2+]mito uptake (left panel) and RH123 fluorescence (right panel) recorded in permeabilized control and Mcl-1 siRNA-treated A549 in response to switching bathing [Ca2+] from 0 to varying [Ca2+] in the range 1.5–3 μM. Data represent mean±S.E. of ≥200 cells pooled from four independent experiments

