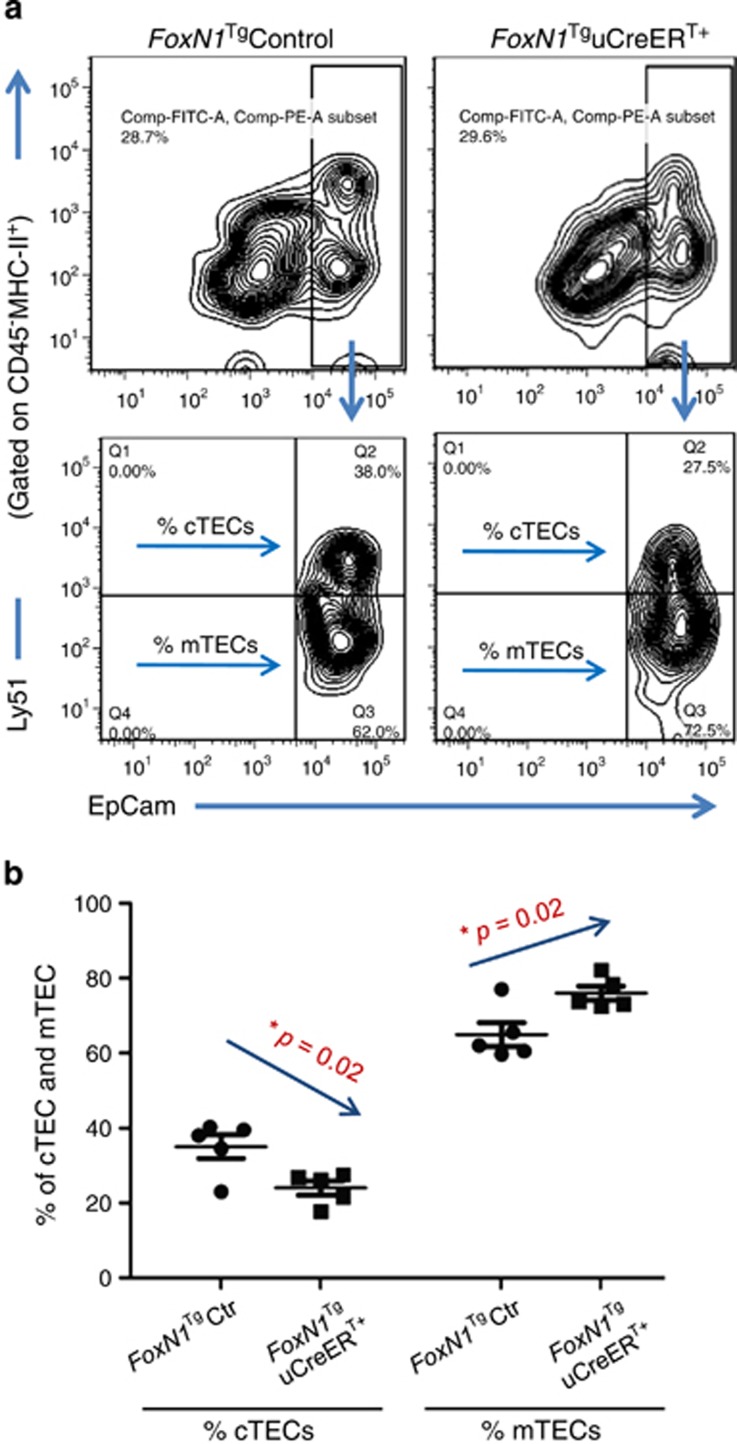
Figure 3.
Ratio of mTEC/cTEC with flow cytometry assay confirms medullary-biased development in FoxN1TguCreERT+ juvenile mice. (a) Contour plots show representative flow cytometric gates of mTEC and cTEC subpopulation; and (b) summarized result from five mice in each group shows decreased percentages of cTECs and increased percentages of mTECs in FoxN1TguCreERT+ juvenile (~20 days after birth) mice. *=statistically significant

