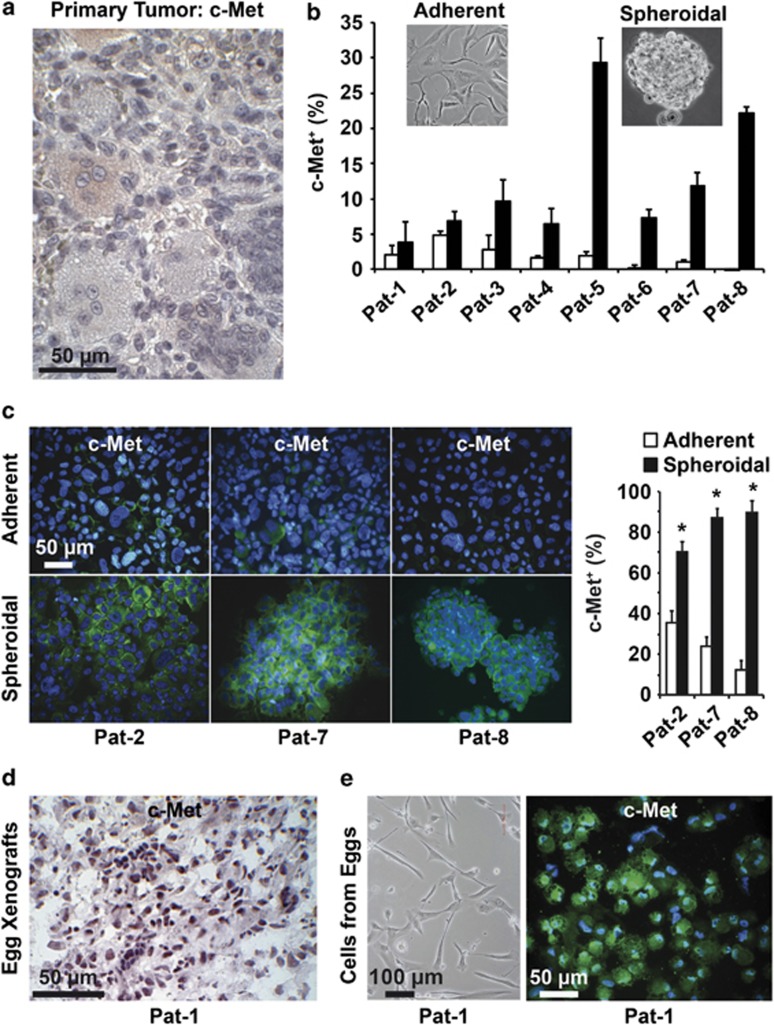
Figure 4.
c-Met is enriched in spheroidal cultures and xenografts. (a) Representative c-Met staining (light red) of a section of surgically resected GCTB tissue at × 200 magnification (n=5). (b) Flow cytometry analysis of c-Met expression in adherent- (white bars) and spheroidal- (black bars) growing GCTB stromal cells. (c) Cytospins were performed from adherent- and spheroidal-growing GCTB cells derived from Pat-2, Pat-7 and Pat-8, followed by immunofluorescence staining of c-Met (green) and DAPI counterstaining of cell nuclei (blue), followed by fluorescence microscopy at × 400 magnification. The bar indicates 50 μm. c-Met+ and c-Met− cells of 10 vision fields were evaluated and are presented as the percentage of c-Met+ cells on the right. (d) Sections from egg xenografts (n=8) derived from stromal cells of Pat-1 were stained with c-Met antibody, and positive cells were detected by immunohistochemistry (dark violet). (e) Characterization of adherent-growing cells isolated from egg xenografts (n=8) from Pat-1. Representative photograph (n=3) of the cell morphology (left) and that of c-Met+ cells after immunofluorescence staining (right: green) with DAPI counterstaining (blue) at × 400 magnification. The scale bars indicate 100 and 50 μm, respectively. The data shown in (b and c) are representative of three experiments performed in duplicates (n=6)

