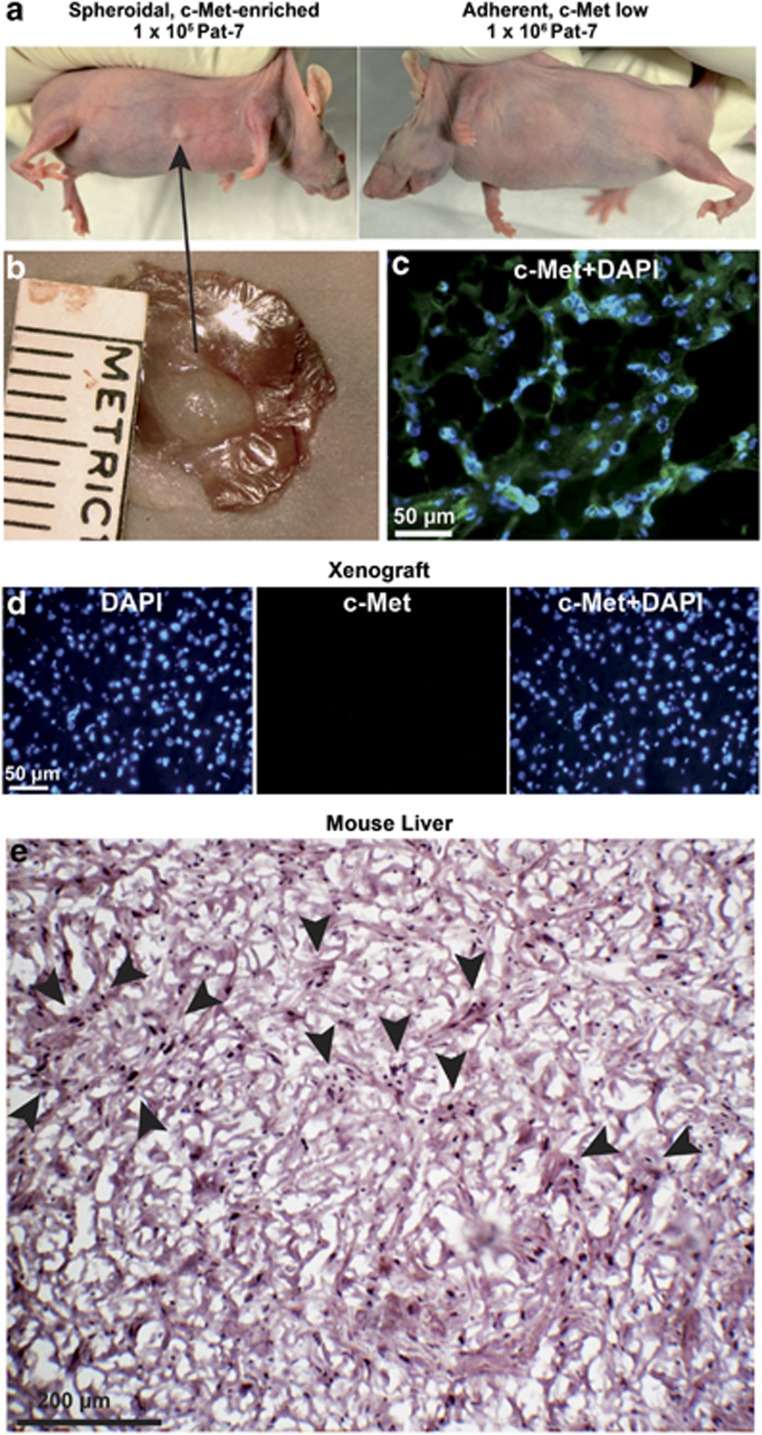
Figure 5.
c-Met+ GCTB stromal cells form tumors in mice. (a) A total of 1 × 10⁵ spheroidal-growing and 1 × 10⁶ adherent-growing Pat-2, Pat-7 and Pat-8 cells were subcutaneously transplanted into the right and left flanks of 15 mice per cell line. Four months later, one mouse developed a tumor at the right flank at the site where spheroidal cells from Pat-7 cells were injected. (b) The tumor xenograft was resected, and the size of 5 × 3 mm2 was determined by calipers. (c) c-Met (green) staining merged with DAPI counterstaining (blue) of a frozen mouse xenograft section derived from Pat-7 cells. The scale bar indicates 50 μm. (d) c-Met control staining (no signal) and DAPI staining (blue) of mouse liver sections (n=5). The scale bar indicates 50 μm. (e) H&E staining of a frozen mouse xenograft section derived from Pat-7 cells. The scale bar indicates 200 μm. Arrows indicate giant-like cells. Owing to a lack of tumor tissue, we could not further evaluate the features of the xenograft

