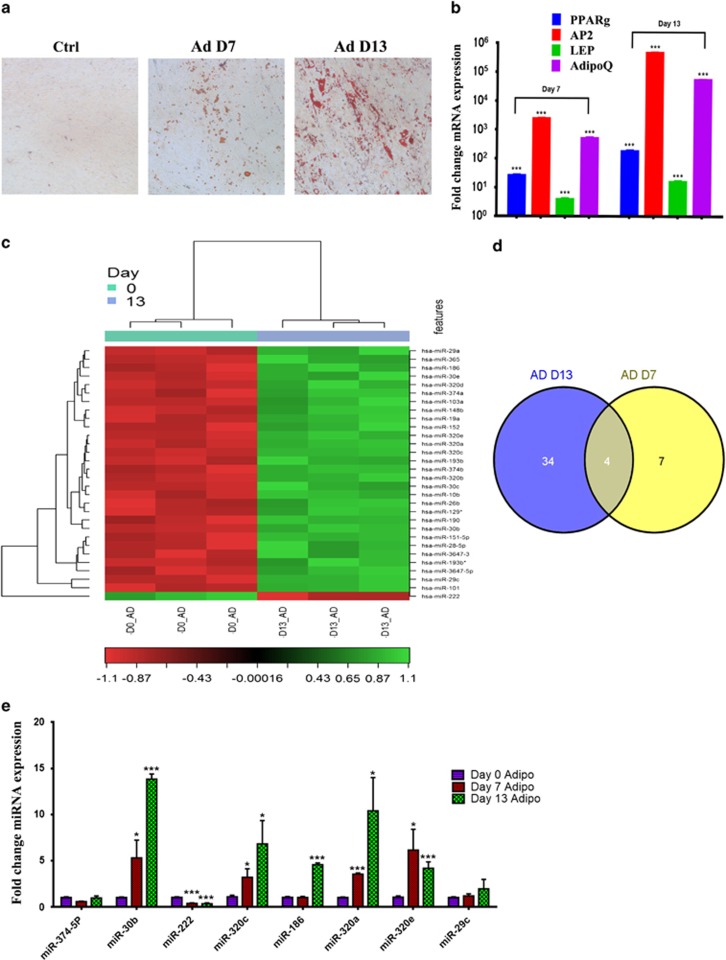
Figure 1.
miRNA expression profiling during adipocyte (AD) differentiation of hMSC. hMSC-TERT cells were induced to AD differentiation. (a) Oil Red O staining of lipid-filled mature ADs on days 7 and 13. (b) qRT-PCR analysis of AD marker genes (peroxisome proliferator-activated receptor-γ, PPARγ; AD protein 2, AP2; leptin, LEP; adiponectin, AdipoQ). Gene expression was normalized to GAPDH and β-actin. Data are presented as mean±S.E. of fold changes compared with non-induced controls, n=6 from two independent experiments. ***P<0.0005 between non-induced and induced samples. hMSC were induced to AD differentiation and on days 0, 7 and 13. miRNA expression profiling was done using the miRCURY LNA miRNA Array (6th GEN). (c) Heat map and unsupervised hierarchical clustering were performed on the top 30 miRNAs differentially expressed on AD day 13 (D13) versus AD D0; the color scale illustrates the relative expression level of miRNAs (log2). Red color represents an expression level below the reference channel, and green color represents expression higher than the reference. (d) Venn diagram depicting the overlap in miRNAs that were differentially expressed on AD D13 and AD D7. (e) Validation of selected miRNAs identified in c using Taqman miRNA qRT-PCR. Data are presented as mean±S.E., n=6. *P<0.05, ***P<0.0005

