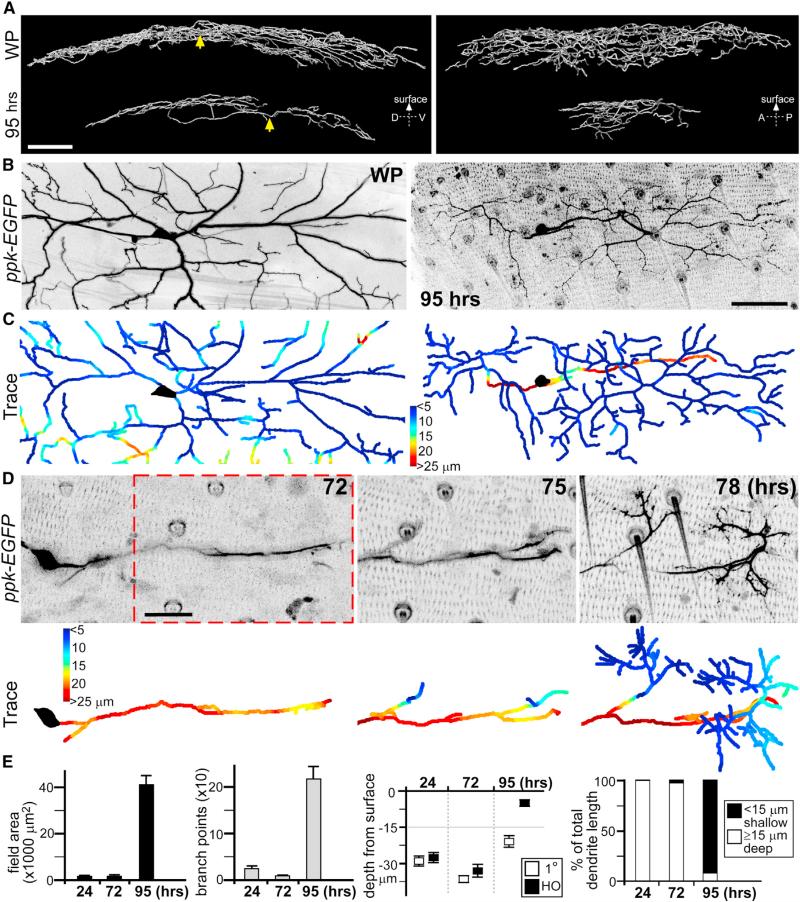
Figure 1. ddaC Neuron Dendrite Regrowth after Pruning.
(A) Reconstruction of ddaC neuron dendrites at the start of metamorphosis prior to pruning (white pupae [WP]), and just before eclosion after dendrite regrowth (95 hr APF). Arrows point to soma positions. D, dorsal; V, ventral; A, anterior; P, posterior. Scale bar, 50 μm. See Movie S1.
(B) x-y view maximum projections from live imaging of abdominal segment ddaC neuron at WP and 95 hr APF (using ppk-EGFP reporter). Scale bar, 50 μm.
(C) Corresponding depths of dendritic arbors from the body wall are colorimetrically represented in traces below: shallow dendrites are shaded blue; deep dendrites are shaded red.
(D) Representative time-lapse live imaging of ddaC neuron secondary dendrite growth from primary dendrite, during regrowth at 72, 75, and 78 hr APF. Depth of arbors from the body wall is colorimetrically represented in corresponding traces below. Seventy-five and 78 hr APF images represent same field of view as in red-dashed box. Scale bar, 25 μm. See Movie S3.
(E) Quantitative analyses of ddaC neuron dendritic arbor changes during regrowth: field area, branchpoints, depth of primary (1°) and higher-order (HO) dendrites from surface, and percentages of total dendrite length that are shallow (within 15 μm from body wall) or deep (≥15 μm) (n = 8 in all groups. Error bars represent SEM. Images of ddaC neuron dendrites are inverted to black on white for clarity. Anterior is up and dorsal is right in all images.
See also Figures S1 and S2.

